
The Finland-based consulting and engineering firm Omnitele has – independently – during first half of 2015 measured the mobile customer experience in three countries: Latvia, Denmark and Estonia.
![]() Without operator sponsorship or influence, Omnitele bought the SIM cards in the respective operator stores and carried out a large field measurement campaign – outdoor and indoors – at Omnitele’s own expense.
Without operator sponsorship or influence, Omnitele bought the SIM cards in the respective operator stores and carried out a large field measurement campaign – outdoor and indoors – at Omnitele’s own expense.
Previously, network tests conducted in the Nordics and Baltics region were paid by one specific operator. With such a setup, you can suspect that a number of tests results never were published and that the paying operator kept its network free from normal maintenance activity during the testing period.
To mimic real customer behaviour, Omnitele has in their tests measured not only the quality of calls and data sessions but also the performance of specific apps like Facebook, Twitter, Instagram and YouTube.
Omnitele asked tefficient if we could correlate their results with key business KPIs of the operators in question.
Have, for instance, operators with good test results used more CAPEX?
As suggested, raw downlink bitrate isn’t necessarily synonymous with best customer experience, but since it still gives a good indication of network capacity and quality, we selected the measured downlink bit rate as basis for our comparison.
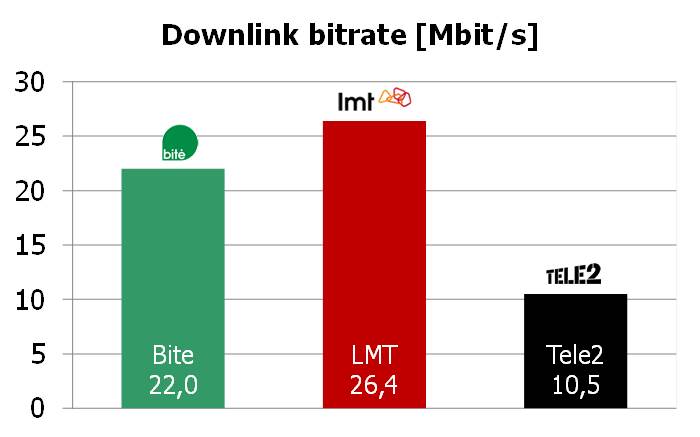
Latvia
Omnitele’s results show that LMT (60% owned by TeliaSonera) provided the fastest average downlink bitrate in Latvia:
Based on reported operator data, we have calculated the CAPEX to service revenue ratio for the Latvian operators in 2014. Our logic is that there is a certain delay in the effect of CAPEX so that what was spent in 2014 should result in customer experience in 1H 2015.
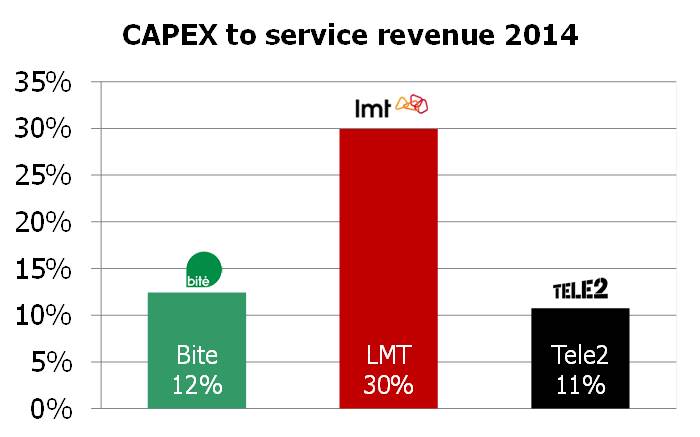 LMT spent a very high 30% of its service revenue on CAPEX in 2014 when quickly expanding its 4G network. And it seems to have paid off since Omnitele’s results show that LMT wins not only in downlink bitrate but in essence in all tested categories.
Are the Latvians then appreciating LMT’s investments in customer experience?
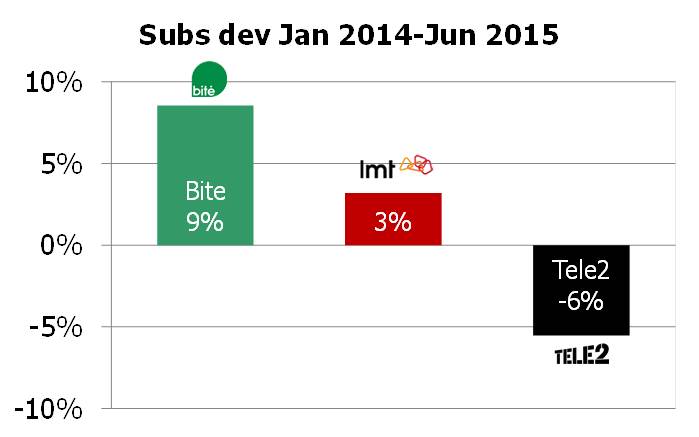
In the 18 months from January 2014 to June 2015, LMT grew its SIM base 3% (postpaid +13%). Bite, the smallest of the three operators in Latvia, grew faster (postpaid +20%) even though Bite’s CAPEX was lower than LMT. Tele2 who in 2014 used the least CAPEX in relation to service revenue (but still 3 MEUR more than Bite in absolute terms) lost market share to Bite and LMT. Following a network swap in 2014 and the launch of 4G in Q3 2014, Tele2 has in 2015 accelerated their 4G depolyment in Latvia with the ambition to reach 90% population coverage on 4G in the end of 2015.
Denmark
The decision of Telenor and Telia to merge their two networks into one shared 2G/3G/4G network – a work that was recently finished – led to a significant improvement of the network coverage and quality that Telenor and Telia could offer. The self-confidence of Telenor and Telia grew and for the first time they could challenge the perception that market-leading TDC had Denmark’s best network. Seldom has a market been fed with as much detailed reporting on site numbers and locations.
As an indication of how important this position is, TDC has during every quarter in 2013 and 2014 (and in Q1 2015) lost market share in consumer mobile to competition. It wasn’t until Q2 2015 that TDC managed to expand its mobile consumer base again.
TDC’s reaction was late, but forceful. In a short period of time, TDC swapped their entire network of 3377 sites – a project that ended in January 2015. About 2300 of these were equipped with 4G, most on 800 the MHz band which quickly adds coverage.
Telenor/Telia reported more sites – 4150 – but TDC still claimed the “Denmark’s best network” spot back in the beginning of 2015.
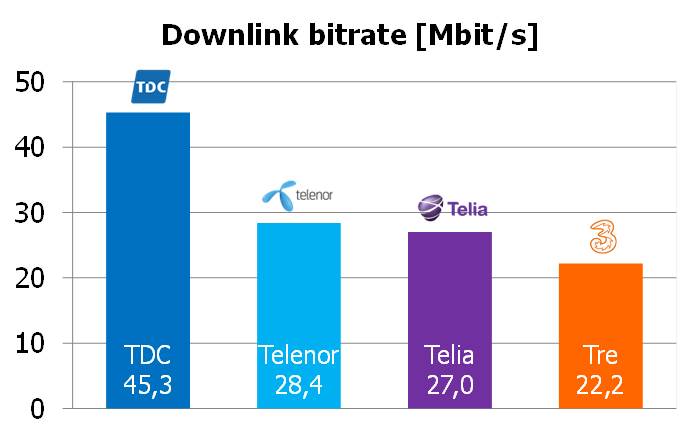
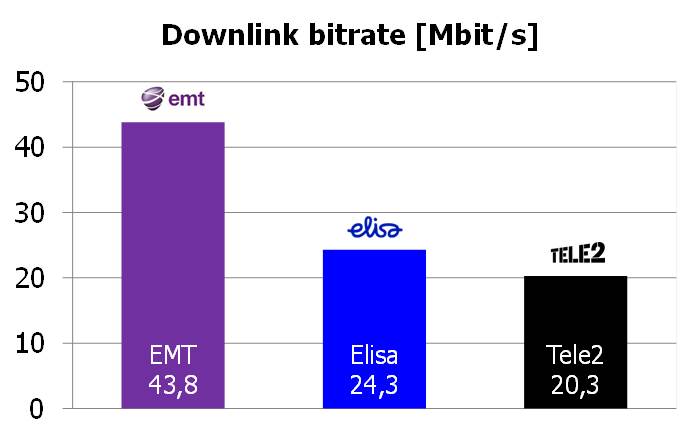
Omnitele’s results show that TDC – after the network changes done – indeed has Denmark’s fastest network:
If we now compare this with the CAPEX to service revenue we can again see that the order is the same:
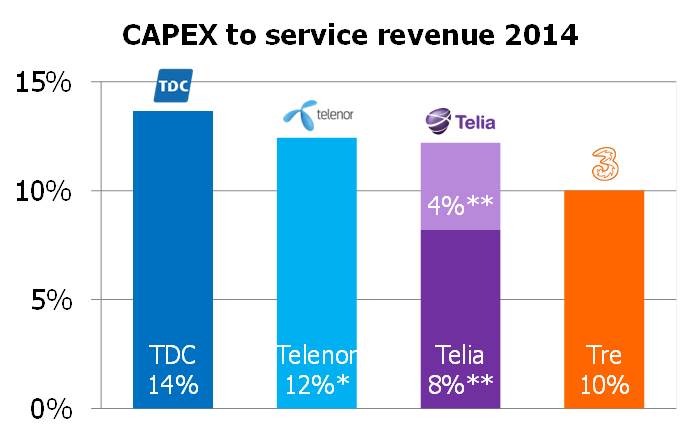
It seems as if TDC’s relatively higher spending on CAPEX in 2014 paid off in network speed. In absolute terms, TDC’s CAPEX was about the same as the CAPEX of all three competitors combined.
*) Including the fixed business of Telenor Denmark (which is rather small) **) TeliaSonera doesn’t report CAPEX in Denmark. Dark purple represents 50% of radio network sharing JV TT-Netværket’s CAPEX and light purple an assumption of non-radio CAPEX.
TDC’s measured throughput should, however, been seen in the light of the average data usage:
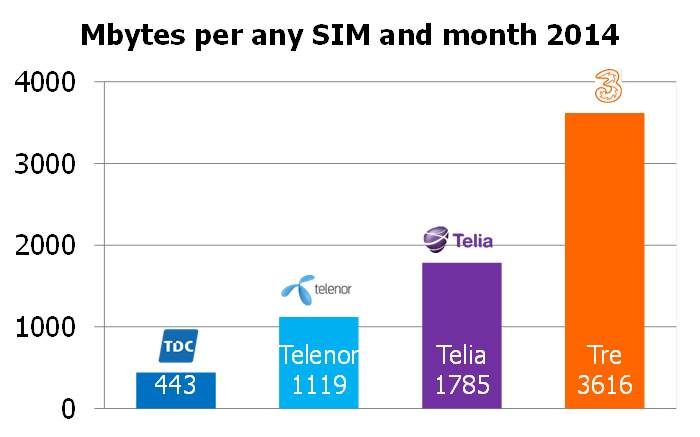
The average Mbyte consumption per SIM card is reversed compared to Omnitele’s measured downlink bitrate. With only 443 Mbytes of usage per SIM card in 2014, it’s fair to say that TDC’s network has a relatively easier job compared to Tre’s. The usage stats have to be based on stats provided by the Danish regulator since none of the Danish operators report data traffic – and regulatory data has the drawback of coming with a delay. TDC has in 2015 indicated a significant uptake in data usage – fuelled by the decision to let all customers have unlimited data during three months up to the end of July 2015.
Even though TDC had positive net adds in Q2 2015, it’s too early for TDC to declare victory when it comes to the subscription development:
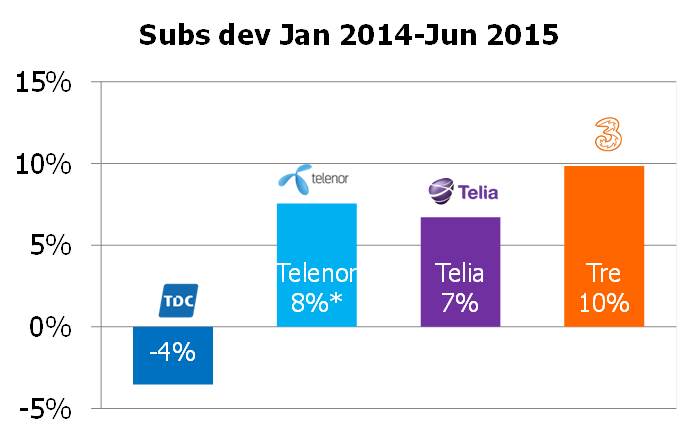
*) Up to March 2015 since Telenor Denmark stopped reporting all figures; Telenor consideres Denmark a discontinued operation awaiting merger clearance with Telia.
TDC has won the latest network tests published, but is now having the same issue as competition had in the past: No matter the reality, it’s the perception of network quality which influences customers’ buying behaviour. And perception takes long time to change.
Estonia
Last of three countries so far measured by Omnitele, also Estonia demonstrates large spread in the downlink bitrate:
But here we don’t have a full match with the CAPEX to service revenue ratio in 2014: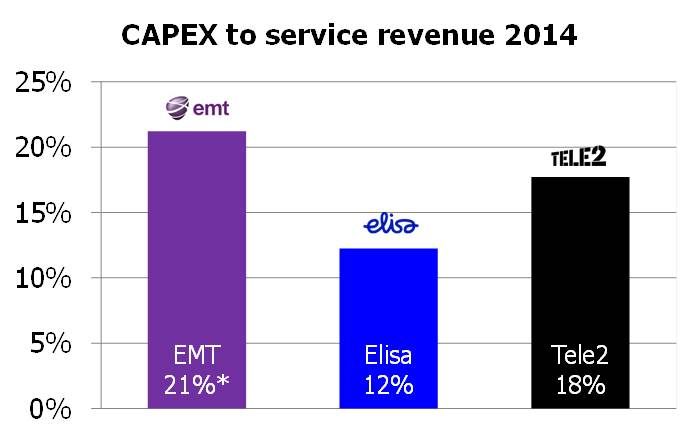
Tele2 has in 2014 in relative terms invested more than Elisa (in absolute terms about the same) likely driven by the network swap which finalised in 2014. Coverage-wise, Tele2 Estonia is also ahead of Tele2 Latvia (see above) since it reached 90% population coverage on 4G already in December 2014.
*) Including the fixed business of Eesti Telekom (Elion) in both revenue and CAPEX.
The subscriber development in the past 18 months again reflect Omnitele’s measurement results:
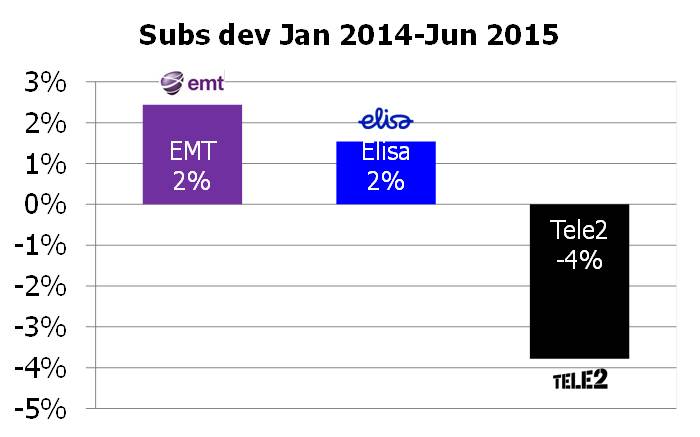
Conclusion
The analysis we’ve made is obviously much lighter than what could have been done with more reported data at hand, but supports this view:
Higher CAPEX produces better test results and a better customer experience. But since it’s about perception, it takes some time to see the results in subscriber base growth. It is also known that operators can optimise CAPEX with more intelligent network analytics.
Link to a summary of Omnitele’s test results: http://www.omnitele.com/2015/mobile-data-customer-experience-in-nordics-baltics/