
OpenSignal released its crowdsourced 4G speed and coverage stats for Q3 2015 today. The data was anonymously collected from a total of 325221 iOS and Android smartphone users globally during June to August.
But before looking into OpenSignal’s new stats, let’s summarise what the Nordic operators have stated with regards to their 4G outdoor population coverage:
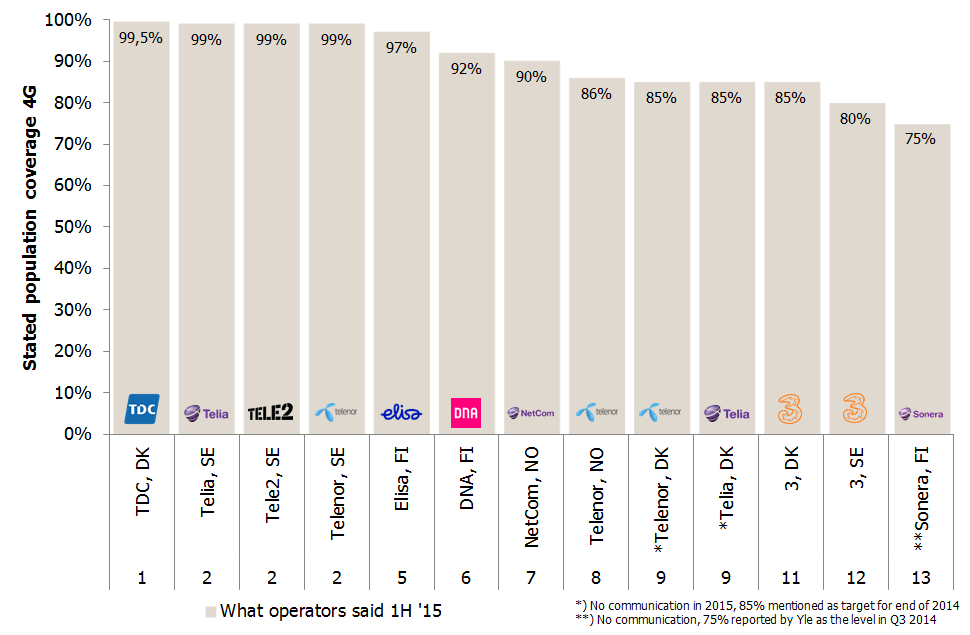
According to TDC, their 4G network is the best covering in the Nordic region with 99,5% of the Danish population covered.
Read about TDC’s Nonstop Retention Index here
The second place is shared between the Swedish operators Telia, Tele2 and Telenor who all have claimed 99% population coverage. (Since Tele2 and Telenor share the same 4G network, Net4Mobility, it’s logical that these two operators are in the same spot.)
Elisa, in 5th position, has stated the highest population coverage in Finland, 97%, whereas NetCom has stated the highest in Norway, 90%.
But are these coverage statements reflecting the actual customer experience?
No. An absolute majority of data traffic is generated indoors – but most operators refrain from dressing their indoor coverage in a population coverage number.
There are a few that do it – for instance Mobistar in Belgium and HT in Croatia – but not in the Nordics.
The official reason is that it’s difficult to predict indoor coverage with a high statistical significance. But the actual reason is rather that the number would be too low for marketing purposes.
If we now instead rank the Nordic operators according to the measured actual coverage for OpenSignal’s users – based on their actual locations and behavioural patterns – the order isn’t the same.
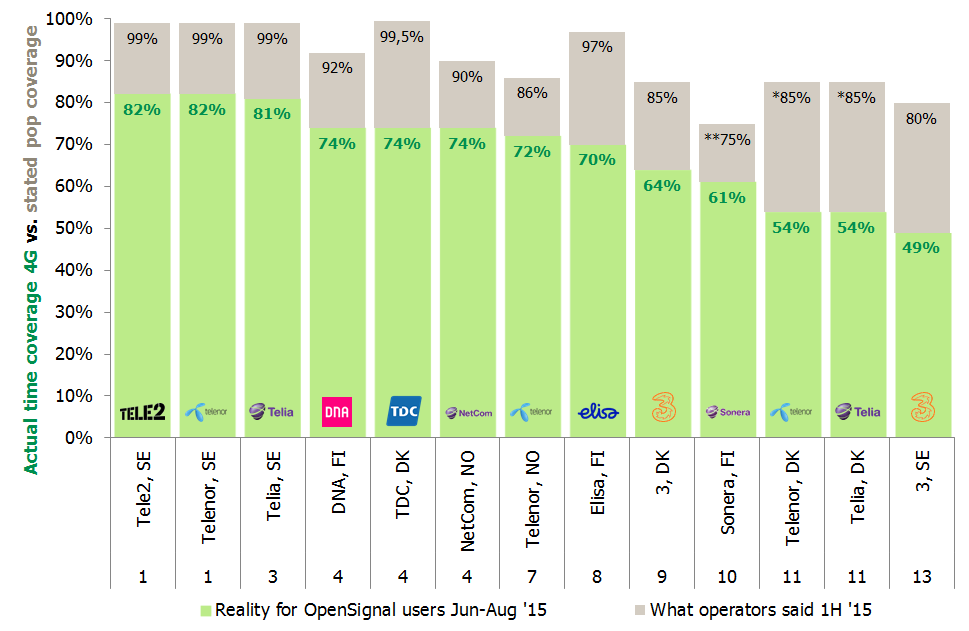
The actual customer experience of TDC‘s 99,5% population coverage is just 74%. This means that OpenSignal users with 4G handsets are on TDC’s 4G network 74% of the time. The remaining 26% of the time their 4G handsets have to be on either 3G or 2G –since there’s no 4G coverage. TDC falls from 1st place to a shared 4th place in the ranking.
Sweden has about 10 times the landmass of Denmark but the three Swedish operators Tele2, Telenor and Telia – who “just” communicate 99% population coverage – are now taking over the top from TDC with an actual time coverage of 81-82%.
Also Elisa loses ground in actual customer experience: From 5th to 8th position. What’s worse for Elisa is that DNA‘s 4G customers are able to spend more time on 4G (74%) than Elisa’s (70%). Elisa’s statement of 97% population coverage is thereby more marketing than reality.
Read about Elisa’s Nonstop Retention Index here
Similarly with 3 in Sweden: Its communicated 80% population coverage is experienced as 49% among 3’s customers.
 We refrain from commenting on Telenor & Telia Denmark (who share the same network, TT-Netværket) and Sonera since these operators haven’t explicitly stated an actual number (see footnotes under the first graph). But we do note that Telia’s webpage (cut-out above) states “Telia has Denmark’s best 4G network”, not just “…Denmark’s best network”. Depending of their definition of “best”, it could suggests that Telia considers its population coverage higher than the 99,5% of TDC.
But even though coverage is the prerequisite for customers to have any 4G experience, it’s also important which experience customers have when they are in the coverage area.
OpenSignal’s other dimension is download speed.
Even though speed isn’t the only parameter for a good customer experience in the coverage area, other service quality KPIs are most often following. An example of this can be found in Omnitele’s measurements in Denmark, Latvia and Estonia where top-ranked operators when it comes to downlink speed (TDC, LMT, EMT) are top-ranked also in service quality.
We have highlighted the Nordic operators in OpenSignal’s coverage vs. speed matrix below (click to enlarge):
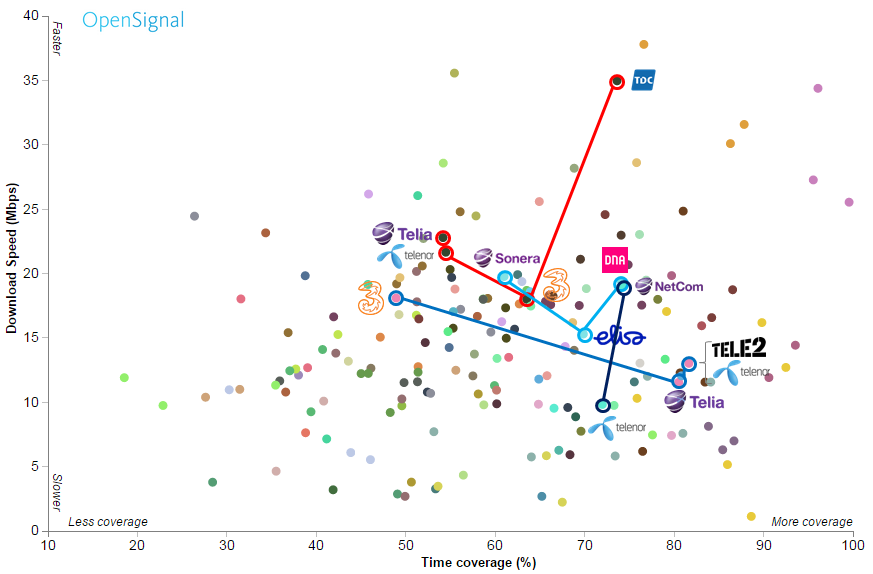
![]() TDC from Denmark is leaving all other Nordic operators in the dust when it comes to average download speed. With 35 Mbit/s, TDC’s network is not only fastest in Denmark, it’s one of the fastest globally. One explanation to this is the very low data traffic TDC has on its network. In the second half of 2014, TDC just carried 14% of the Danish data traffic compared to their SIM market share of 38%. Since the speed depends on the number of users who traffic a network, an empty network is always fast. But as long as TDC’s network has as low load, it provides the best local 4G experience: TDC wins both the coverage and the speed dimension in Denmark.
TDC from Denmark is leaving all other Nordic operators in the dust when it comes to average download speed. With 35 Mbit/s, TDC’s network is not only fastest in Denmark, it’s one of the fastest globally. One explanation to this is the very low data traffic TDC has on its network. In the second half of 2014, TDC just carried 14% of the Danish data traffic compared to their SIM market share of 38%. Since the speed depends on the number of users who traffic a network, an empty network is always fast. But as long as TDC’s network has as low load, it provides the best local 4G experience: TDC wins both the coverage and the speed dimension in Denmark.
 In Finland, it’s DNA who provides the best 4G experience: Same speed as Sonera, but the highest coverage. Since Sonera and DNA now co-build the rural parts of Finland through the Yhteisverkko JV, Elisa should be worried having been overtaken by DNA in coverage while – for the first time – losing the speed dimension in Finland.
 In Norway, it’s NetCom who provides the best 4G experience. Telenor almost matches NetCom’s coverage, but has the slowest 4G experience in the Nordics.
![]()
![]() Finally Sweden where the Tele2/Telenor network provides the best 4G experience. Telia has improved coverage significantly in the past year, though. Telia thereby effectively closed the gap on Tele2/Telenor. The speeds of these networks start to disappoint though, indicating that 4G networks aren’t immune to load. With a growing data traffic and a rapidly increasing 4G penetration, the time when 4G networks could be built just for coverage is over.
Finally Sweden where the Tele2/Telenor network provides the best 4G experience. Telia has improved coverage significantly in the past year, though. Telia thereby effectively closed the gap on Tele2/Telenor. The speeds of these networks start to disappoint though, indicating that 4G networks aren’t immune to load. With a growing data traffic and a rapidly increasing 4G penetration, the time when 4G networks could be built just for coverage is over.
 Sweden shares this experience with the US where operators also provide good coverage, but struggle to deliver the same 4G speeds as the service originally did.
3 in Sweden is again winning over the other Swedish 4G networks in speed – but coverage-wise it’s the weakest 4G network in the Nordics.
Finally, can we trust crowdsourced data? There is an element of statistical insignificance in it.
Are drive tests better? How representative is it for the customer experience to gather a few thousand data points driving along main roads and in city centres when usage happens indoors? Crowdsourced data have millions of data points and is based on the actual behaviour of real customers.
Are mathematical prediction models better? If so, operators can prove it by starting to report indoor population coverage.