
Pioneering insights into fixed wireless access offerings and dynamics – and how FWA should co-exist with fibre to maximise the market
New chance to join in 2026
Background
Skip the background, take me to the FWA tracker
The introduction of 5G has perhaps not yet delivered on all promises, but it has actually exceeded all expectations in one segment: broadband.
Although fixed wireless access (FWA) was an established product in as diverse markets as Finland, Austria, Australia, and the Philippines already before the launch of 5G, most mobile operators elsewhere were either avoiding to offer it or limiting it by selling it only in e.g. rural areas.
But 5G – with all its added spectrum – unleashed mobile operators and 5G-based FWA now proves to be a major sales success also in markets that previously didn’t have any FWA. And it’s not just offered by pure mobile operators, now integrated operators with both fixed and mobile have started to offer FWA too – to complement its fixed broadband reach or to address households and small businesses which a higher requirement on location mobility than fixed broadband can deliver.
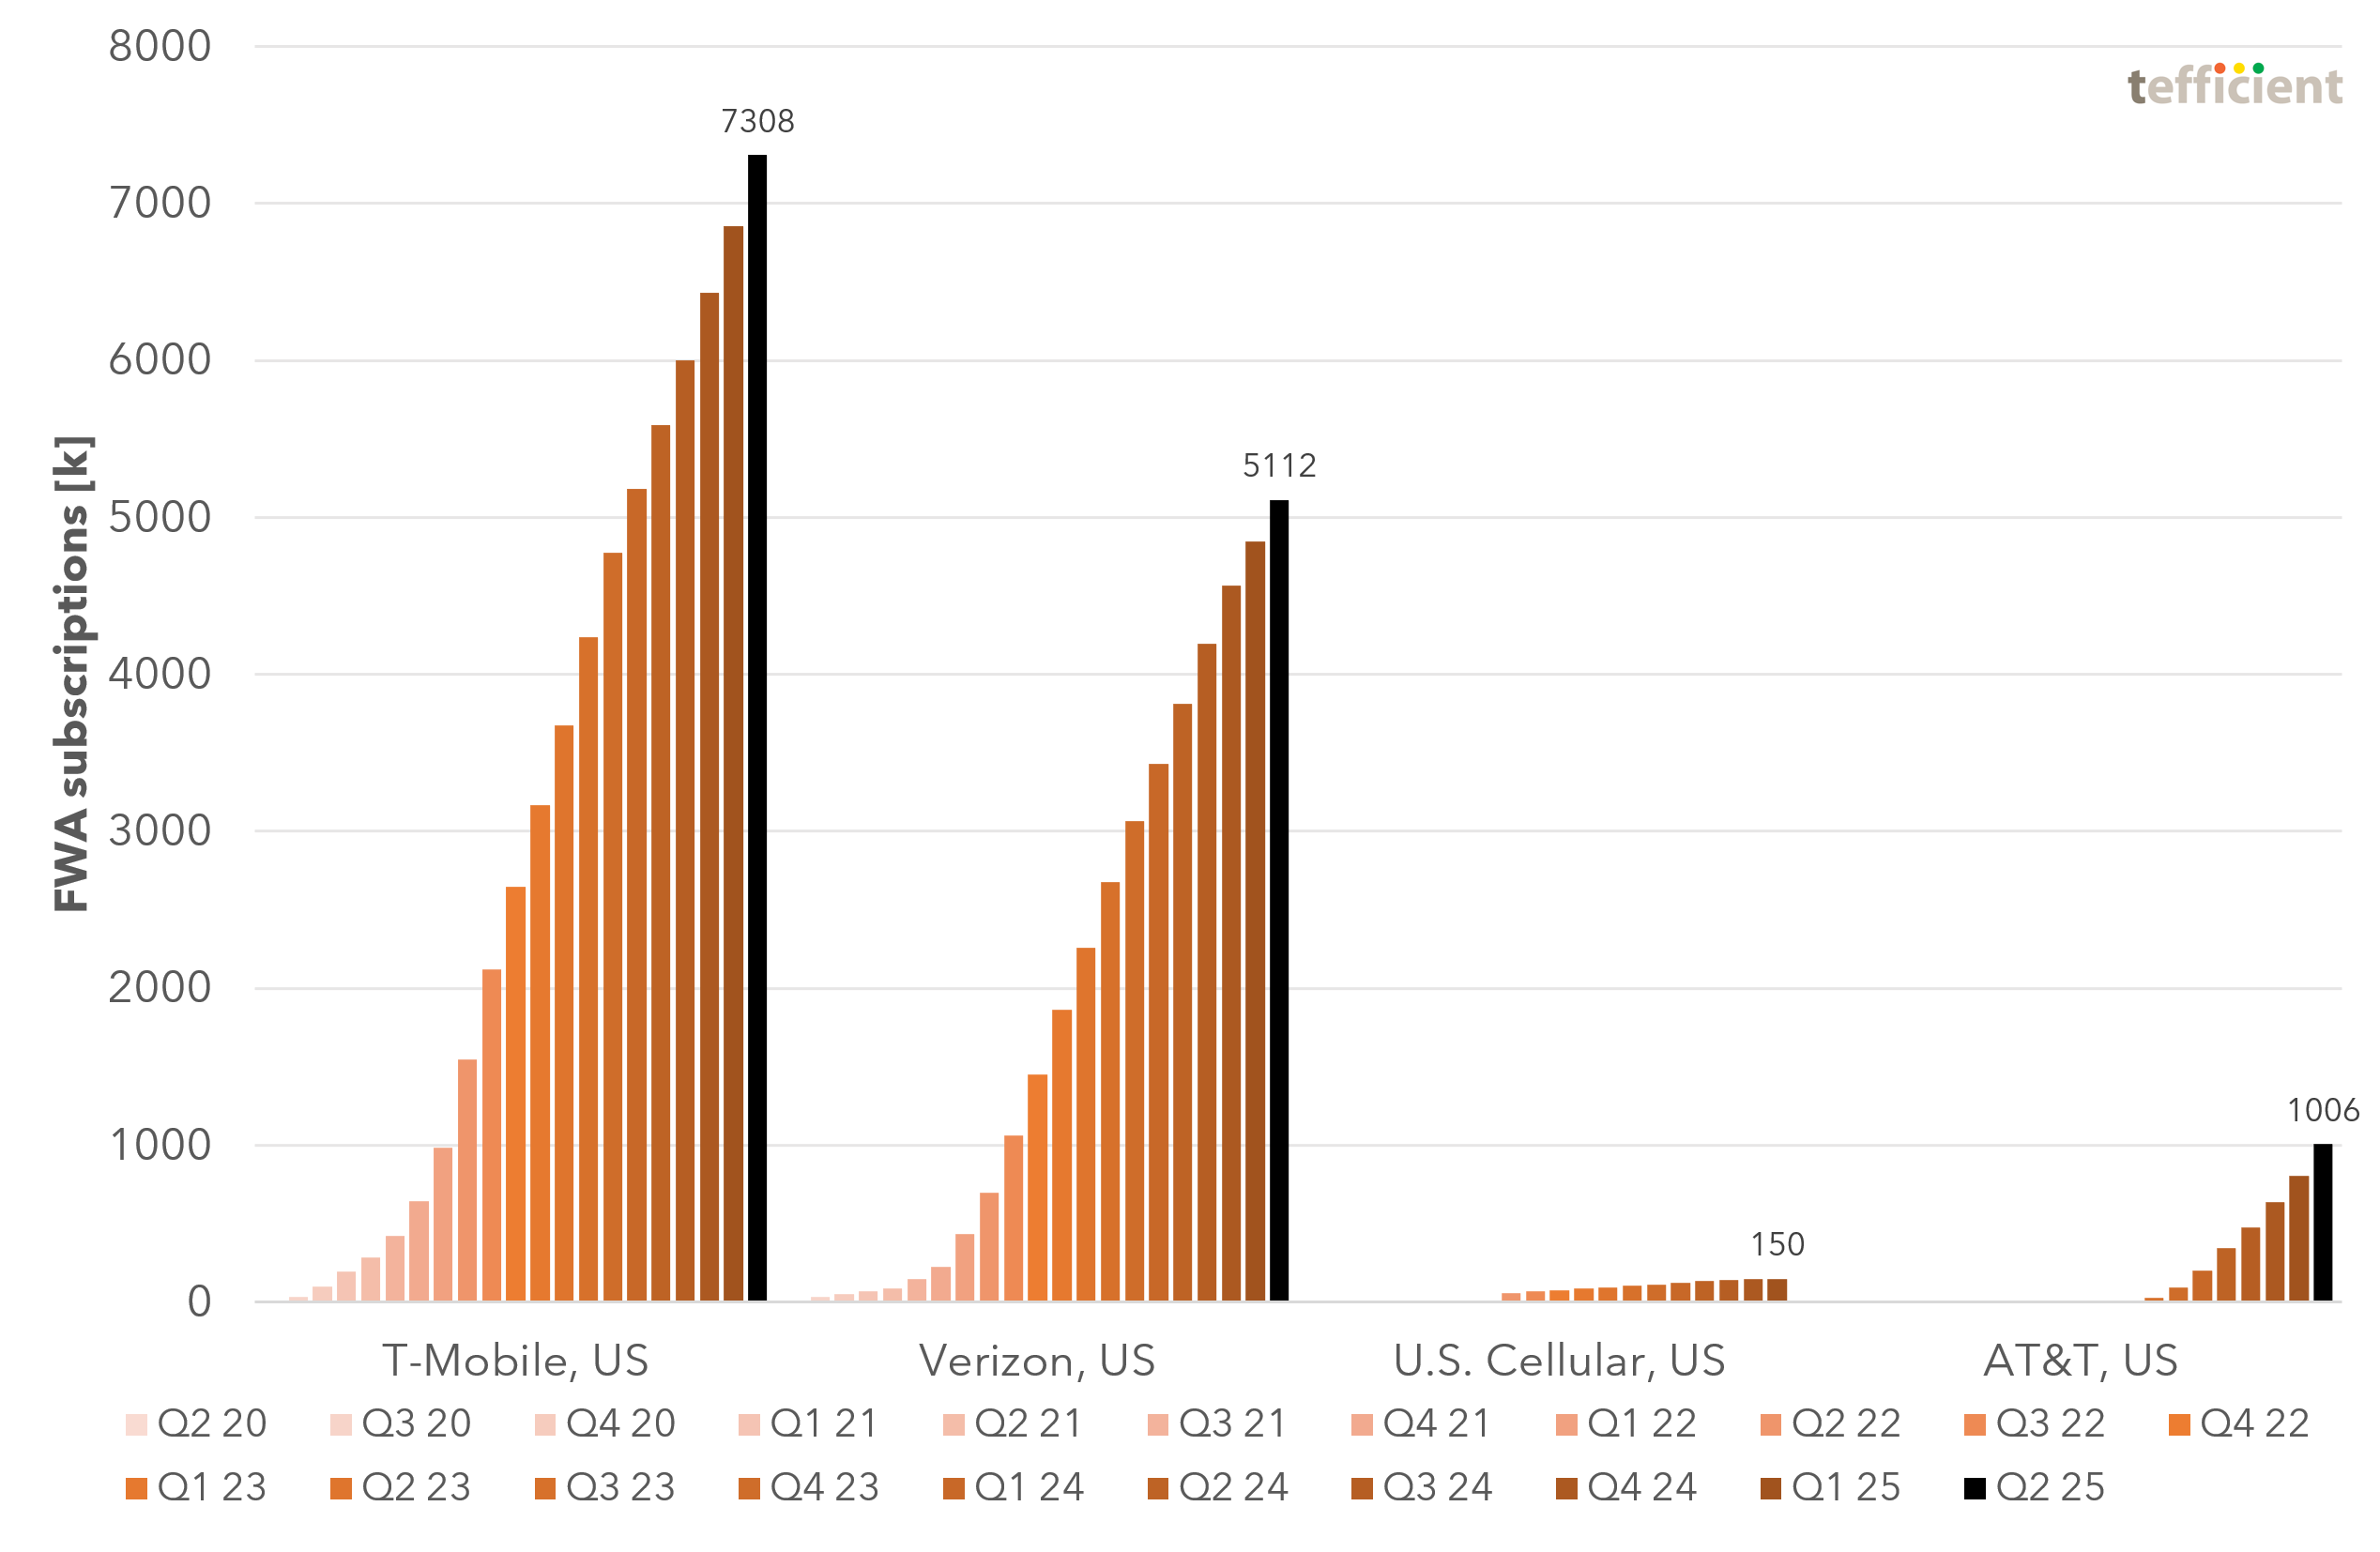
The US is a compelling example of a booming FWA market.
By June 2025, T-Mobile had gained 7.308 million FWA subscribers whereas Verizon – who unlike T-Mobile also provides fixed broadband – built a base of 5.112 million FWA subscribers. US Cellular had a total of 150 thousand FWA subscribers in March 2025 before it sold its operation to T-Mobile. AT&T did initially not follow its mobile competitors in launching FWA, but eventually put its Internet Air offer on the market in Q3 2023. It had 1.006 million subscribers in June 2025.
These numbers are large, but do they make an impact on the overall broadband market? Yes, a massive impact.
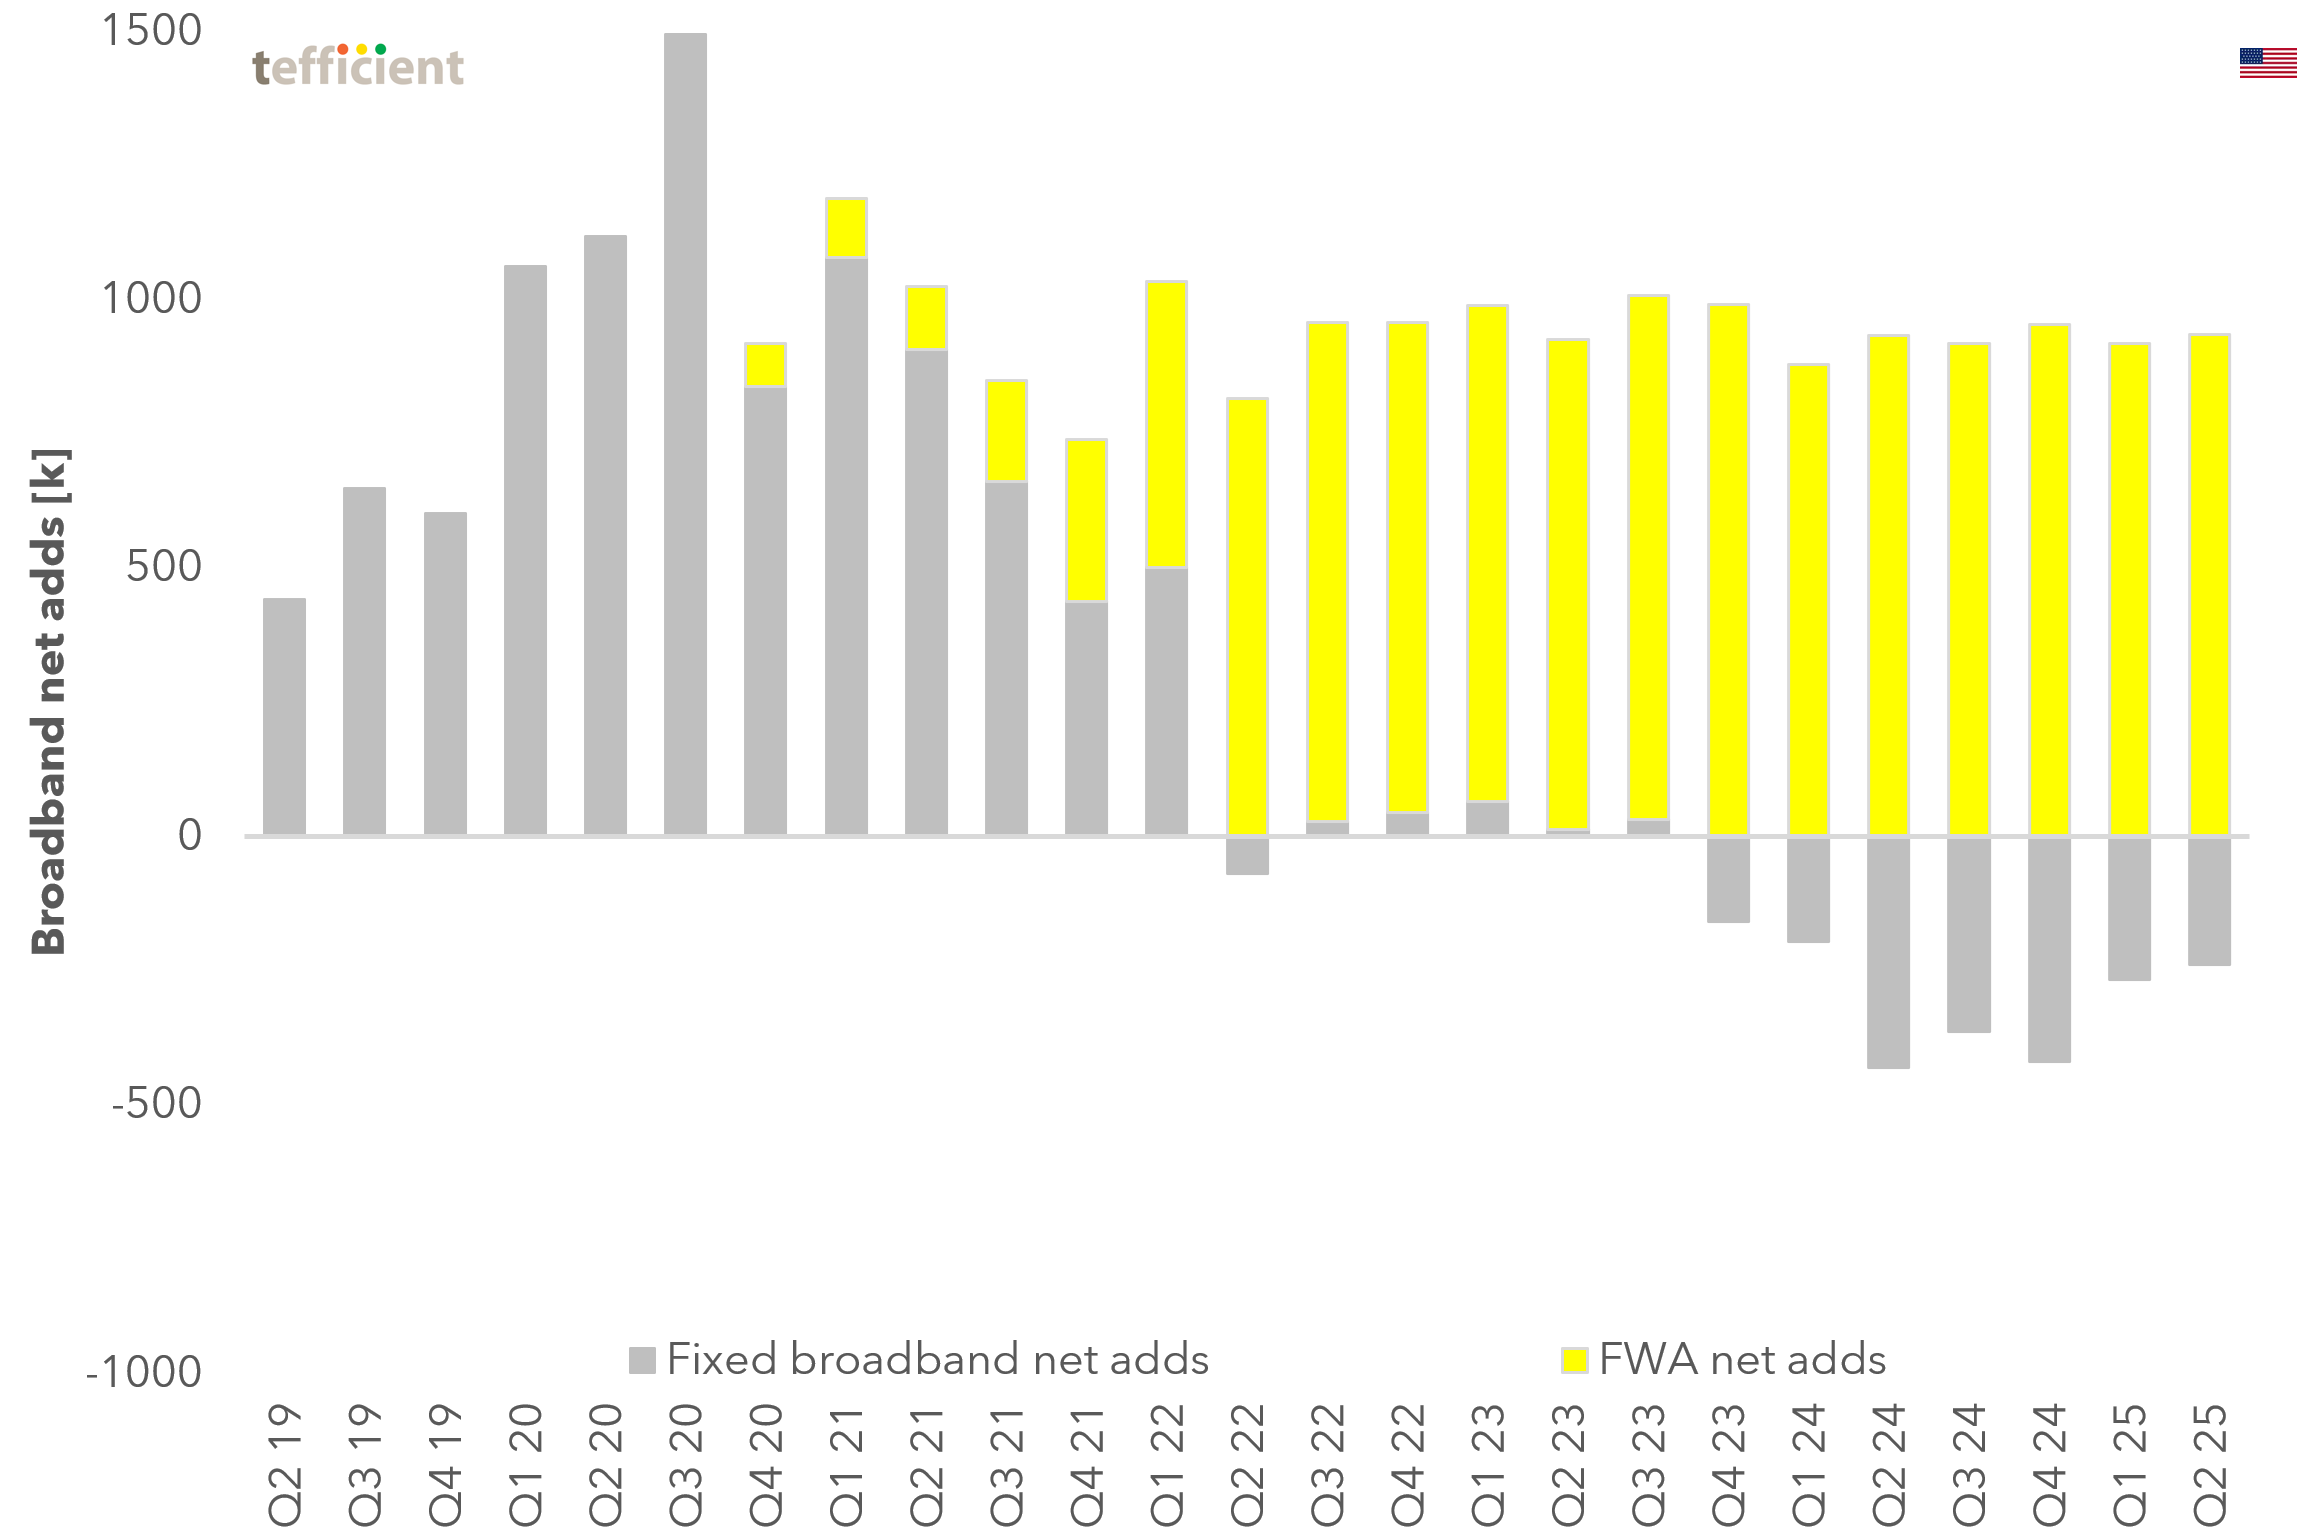
If we sum up the reported broadband net adds for a total of seven US broadband providers, Comcast/Xfinity, Charter/Spectrum, Verizon, AT&T, Altice/Optimum, T-Mobile, and US Cellular, we get the graph above.
Since mid 2022, the fixed broadband base of the US is, in essence, no longer growing.
At the same time, FWA providers add roughly 900 thousand FWA subscribers per quarter. Prior to the launch of FWA, fixed broadband had a similar growth as FWA now has. It very much looks as if the growth of FWA has come at the expense of fixed broadband growth.
FWA has been a sales success also elsewhere. If we look at Europe, Austria and Finland are two markets where mobile operators early, actually already during the 3G era, embraced FWA. In our appreciated public mobile data usage analysis (latest update here), you can see what this means for the average mobile data usage of these two countries.
But rather than repeating what is already said about Austria and Finland in that analysis, we here point at Norway as a European example of a 5G-based FWA success.
The background is that the telecom incumbent there, Telenor, had an aggressive plan to retire its copper network, thereby forcing hundreds of thousands of DSL (and PSTN) subscribers to pick a more modern technology while Telenor risked to lose them to competition. Although Telenor already had a cable TV network that of course could deliver internet, and although Telenor rapidly expanded the reach of its fibre network, it could not replicate the nationwide coverage of the copper network. So Telenor decided to, in parallel, bet on FWA. It worked well – competition was slow to respond, but currently takes market.

In June 2025, Telenor had 116 thousand FWA subscribers in Norway. It might not sound that much after having seen the US figures, but since the total broadband base, including FWA, of Telenor is just 701 thousand, FWA represents 17% of Telenor’s broadband base.
FWA represents 17% of Telenor’s broadband base in Norway.
In the process of sunsetting the copper network – a process completed for the retail market in 2023 – Telenor did lose broadband subscriptions, but without FWA it would have looked much worse. It’s worth mentioning that Telenor’s main mobile competitor, Telia, launched FWA too and has managed to gain 66 thousand FWA customers by the end of June 2025, representing about 14% of Telia’s total broadband base. And unlike Telenor, Telia’s FWA base still grew.
Staying in Europe, we have also seen successful FWA launches by mobile operators in e.g. Denmark and France. But the established FWA markets isn’t limited to Austria and Finland, we also have Lithuania, Latvia, and Poland.
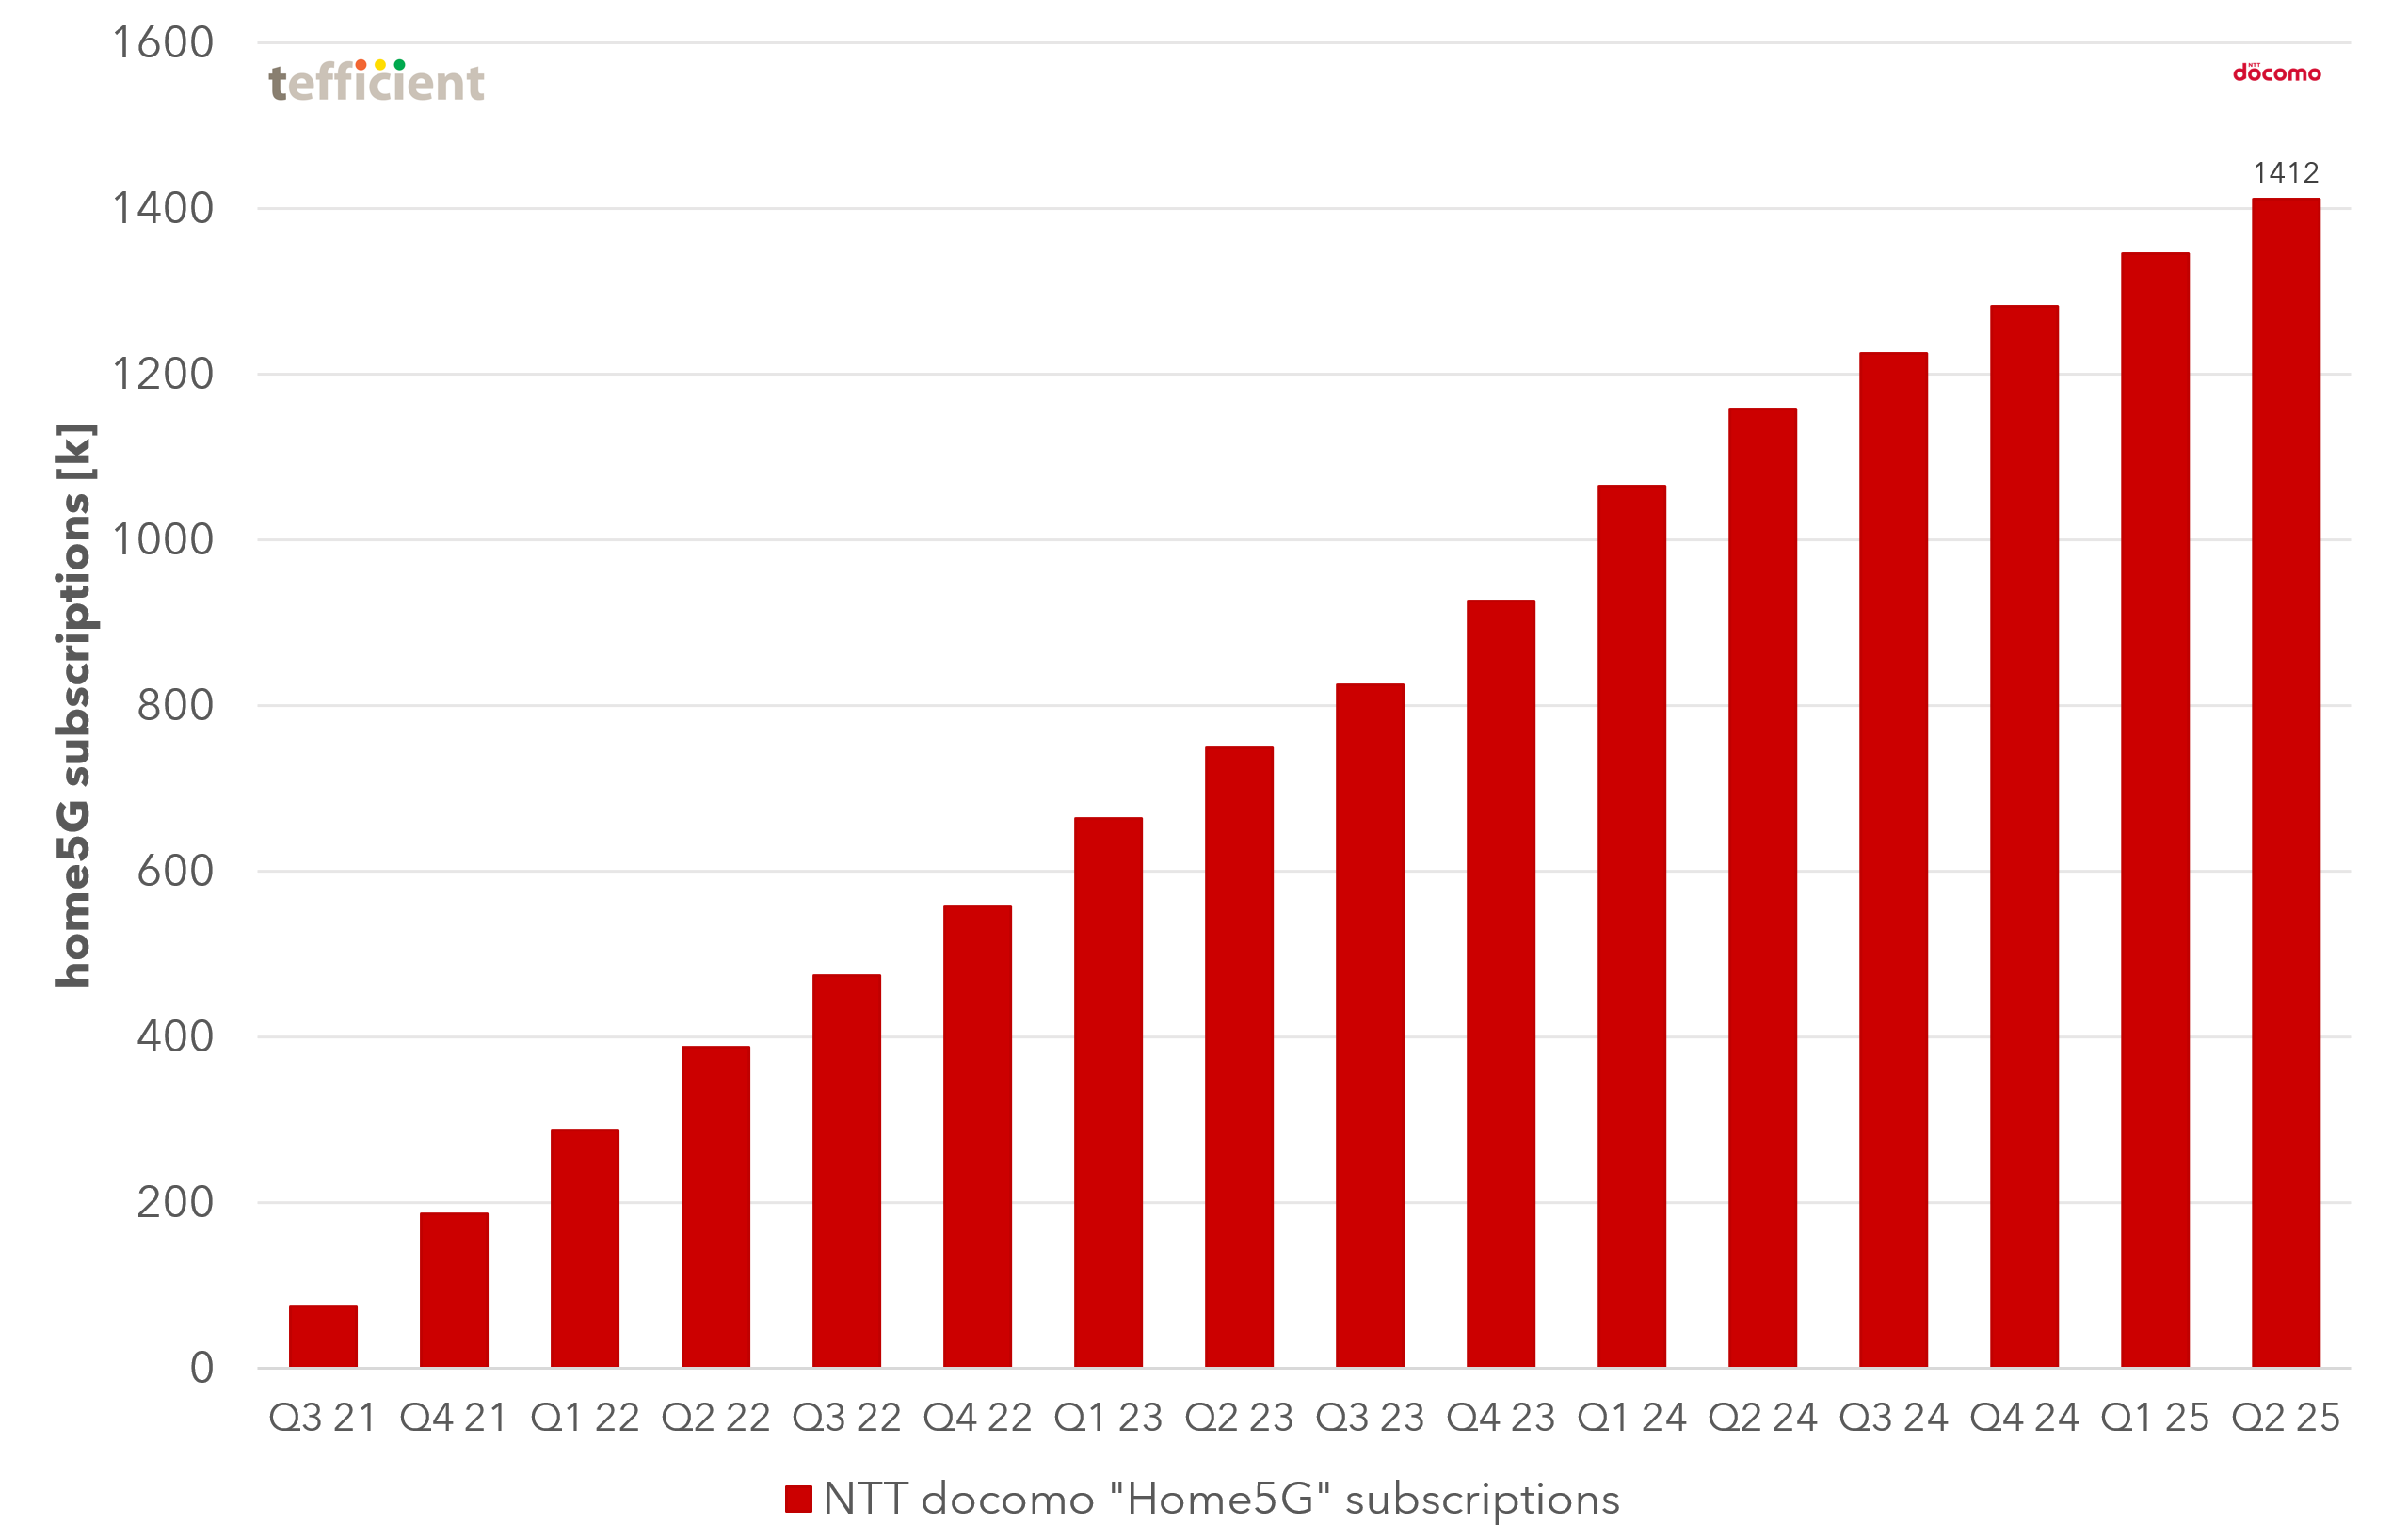
Surprisingly, even in highly developed, fibre-everywhere, Asian markets like Hong Kong and Japan, FWA has seen remarkable success, exemplified by NTT docomo’s acquisition of 1.412 million subscribers to its home5G FWA service in a short time.
5G came late to India. The two main operators, Jio and Airtel, launched it in Q4 2022. But the roll-out and customer take-up has been very fast. In part because of FWA: Less than two years after its FWA launch, by the end of June 2025, Jio had 7.4 million subscribers on its 5G FWA product AirFiber thus overtaking T-Mobile USA as the world’s largest FWA operator. Surely one explanation to why Jio in December 2024 already had 40% of its wireless data traffic on 5G.

Let’s say that we see a trend here. But who aims to track and document the FWA development and its impact across key markets globally? Tefficient does.
Tefficient’s FWA tracker
The description below covers the current plan for Tefficient's FWA Tracker of 2026. The scope might be adjusted. We are currently gathering feedback from our customers.
In response to the escalating prominence of FWA globally, Tefficient repeats its innovative annual offering—the FWA tracker. Encompassing 20 key markets, including Australia, Austria, Denmark, Estonia, Finland, France, Hong Kong, India, Ireland, Italy, Japan, Latvia, Lithuania, Norway, Poland, South Africa, Spain, Sweden, the UK, and the USA, this tracker captures the offerings and statistics of about 80 FWA providers.
The markets are selected based on the availability of FWA offerings, the FWA maturity and the availability of take-up or outcome data. If a market in your view still is missing, let us know. (Should e.g. the Netherlands, Czechia, and Belgium be covered?)
The planned timeline for Tefficient’s FWA tracker of 2026 is:
The comprehensive analysis draws insights from regulatory data, reported FWA take-up, broadband revenues, actual FWA propositions, and Tefficient’s expertise in data usage and monetisation. The outputs include trend charts showcasing FWA’s share of the base, broadband base split by technology, household adoption trends, data usage comparisons, fiber household availability, and a complete documentation of FWA propositions.
The inputs are:
- Regulatory data for the 20 markets
- Reported FWA take-up and broadband revenues of the about 80 FWA providers
- Actual FWA propositions from the about 80 FWA providers
- Tefficient’s intelligence in data usage and data monetisation
The outputs are:
- Trend charts showing FWA’s share of base compared to mobile and fixed broadband
- Trend charts showing the split of the broadband base per technology such as fibre and FWA
- Trend charts showing the household adoption of respective technology
- A comparison of fibre household availability per market
- A comparison between the data usage of FWA with that of fixed and mobile broadband
- A comparison of ARPU for FBB with FWA
- A complete, categorised, documentation of all FWA propositions
- Price
- How are the CPEs integrated into the offering – buy, loan, rent, BYOD, … ?
- What is the policy and offering with regards to outdoor CPE?
- What is the policy with regards to data usage/caps, best effort/speed, throttling, slicing, … ?
- How do binding contract periods compare?
- How is FWA tiering done? On speed, QoS priority or guarantee, CPE, mesh, inclusive content, … ?
- Where is FWA offered? To specific addresses only (after address search) or anywhere? Is there a requirement of a permanent address? Is FWA offered only if fixed broadband isn’t available or as an option even if fixed broadband can be delivered?
- What are the key “why FWA” messages? Price, deployment speed, location flexibility, …?
- How does the subscription price of FWA compare in-country to that of fixed broadband? What service has a price premium – fixed broadband or FWA?
- Trend charts showing the reported FWA take-up per provider
- Trend charts showing the reported FWA data usage per provider
- Trend charts showing the reported FWA revenue/ARPU per country or per provider – and a comparison to fixed broadband where possible
- Customer-specific recommendation: What’s your opportunity in your market? What are the best practices that apply in your case? What’s Tefficient’s recommendation?
The deliverables are:
- A tailored 200+ page PowerPoint report
- Management presentation or workshop
- One or two follow-up presentations or workshops on request
This invaluable resource is offered at a fixed fee which is the same for all customers.
How do you use it?
Whether launching FWA, optimising existing offerings, or strategising defense against FWA, providers can utilise the insights from Tefficient’s FWA tracker:
- Mobile and fixed providers that have not yet launched FWA could use the analysis as basis for how to launch.
- Providers that have a live FWA offer could use the analysis to get input and inspiration on how to shape up the proposition so that it performs better on the market – and how it should be balanced with the fixed broadband offering.
- Does it make sense to offer FWA in flanker brands?
- Are you capturing the potential of FWA in the business market?
- Fixed providers that can’t offer FWA could use the analysis to understand how to better defend against FWA.
If you are a fixed or mobile provider keen on exploring the full potential of this analysis, please don’t hesitate to reach out to us.