
Subscribe to our public industry analyses – to get them emailed to you before they are published here
8 June 2026
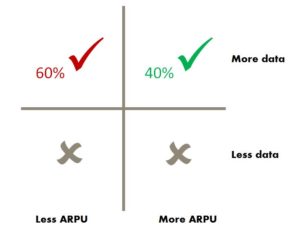
New! More data used – only half of markets grew ARPU
Tefficient’s 47th public analysis of mobile data trends and drivers compares data from 40 countries where M2M/IoT can be excluded from the total bases. Mobile data usage grew year-on-year in all markets, but Hong Kong’s usage was flat.
In the absence of 2025 data from Saudi Arabia, Latvia emerges as the usage leader.
After the sharp slowdown between 2023 and 2024, usage growth rates have largely stabilised. Half of the markets recorded faster growth in 2025 than in 2024. Among the countries analysed, Portugal posted the highest annual increase at 37%. No market experienced a decline in usage, although growth in Hong Kong was close to zero.
Data-only subscriptions – while still accounting for a relatively small share of the market – continue to drive average usage levels. Latvia leads with 236 GB per month, followed by Sweden at 164 GB. In the pure FWA segment, Australia topped the chart with 436 GB per month, followed by Sweden with 374 GB and Ireland with 332 GB.
In contrast to data-only subscriptions, the impact of 5G on overall traffic remains limited, except in South Korea, China, Austria, and Lithuania.
Mobile service revenue per gigabyte continued to decline overall, at a rate consistent with previous analyses. Portugal recorded the steepest drop at 31%. However, inflation-hit Turkey again saw a sharp increase in revenue per gigabyte.
Despite growth in data usage across all markets, only about half of the markets analysed recorded ARPU growth, an as weak outcome as in the previous edition of this analysis.
19 November 2025
ARPU growth softens further as mobile data usage growth slows in half of the countries

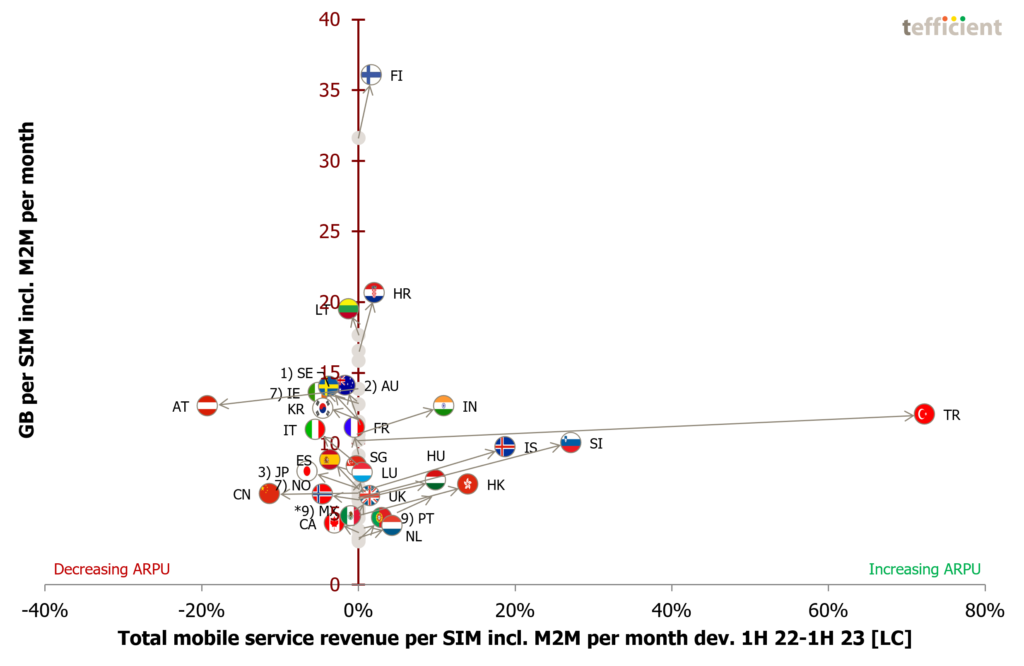
Tefficient’s 46th public analysis of mobile data trends and drivers compares data from 40 countries where M2M/IoT can be excluded from the total bases. Mobile data usage grew year-on-year in most markets, but Turkey and Qatar recorded declines.
Saudi Arabia remains the usage leader and Latvia the runner-up.
After the sharp slowdown from 2023 to 2024, usage growth rates have largely stabilised. However, about half of the countries had slower growth in the first half of 2025 compared with the same period in 2024. Among the countries reported so far, Portugal posted the highest annual increase at 32%.
Data-only subscriptions – though still representing a small share of the market – continue to drive average usage levels. Latvia leads with 195 GB per month in 2024, followed by Sweden with 156 GB per month in the first half of 2025. In the pure FWA segment, Australia topped the chart with 477 GB per month in 2024, followed by Sweden with 379 GB and Ireland with 294 GB per month – both in the first half of 2025.
In contrast to data-only subscriptions, the impact of 5G on overall traffic remains limited – except in South Korea, China, Austria, and Lithuania.
Mobile service revenue per gigabyte continued to decline overall, although at a slower pace than before. Portugal saw the steepest drop at 27%. However, inflation-hit Turkey again recorded a surge in revenue per gigabyte, and Finland and Croatia also saw increases.
Only 54% of markets experienced ARPU growth, even though 92% had growth in data usage – once again a softer outcome than in the previous edition of this analysis.
18 September 2025
69% of operators leveraged pricing power to
increase ARPU alongside rising data usage

In Tefficient’s 45th public analysis of mobile data trends, 116 operators are ranked based on metrics such as average data usage per subscription, total data traffic, and revenue per gigabyte.
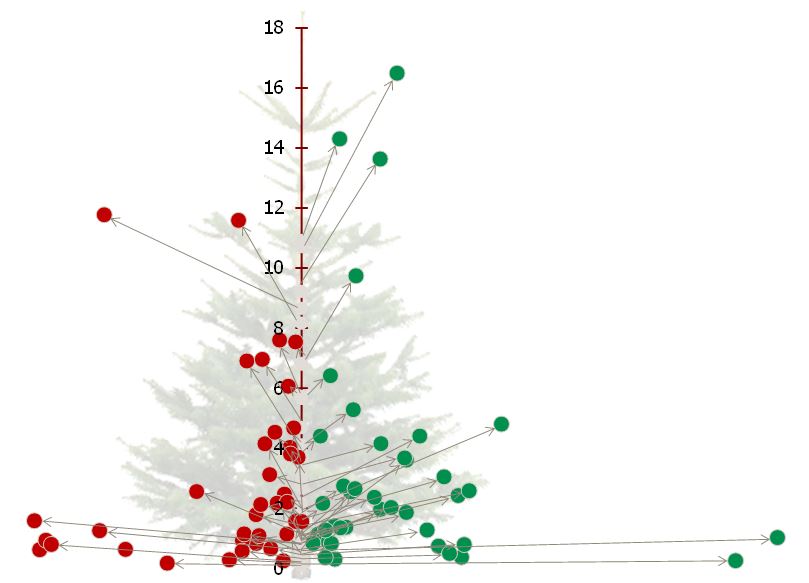
In 2024, 94% of operators saw growth in data usage per subscription, with 69% successfully converting this into higher ARPU. This trend continued into the first half of 2025: 93% experienced increased data usage, and 68% translated that growth into higher ARPU. The performance is roughly in line with 2023, although it still reflects a decline from 2022 levels.
Operators unable to capitalise on pricing power – therefore experiencing falling ARPU – tend to operate in the bottom left low-usage area of the Christmas tree. A risky spot.
This analysis is sponsored by DNA.
9 June 2025
The demand for additional mobile data is weaker than ever – ARPU growth softens
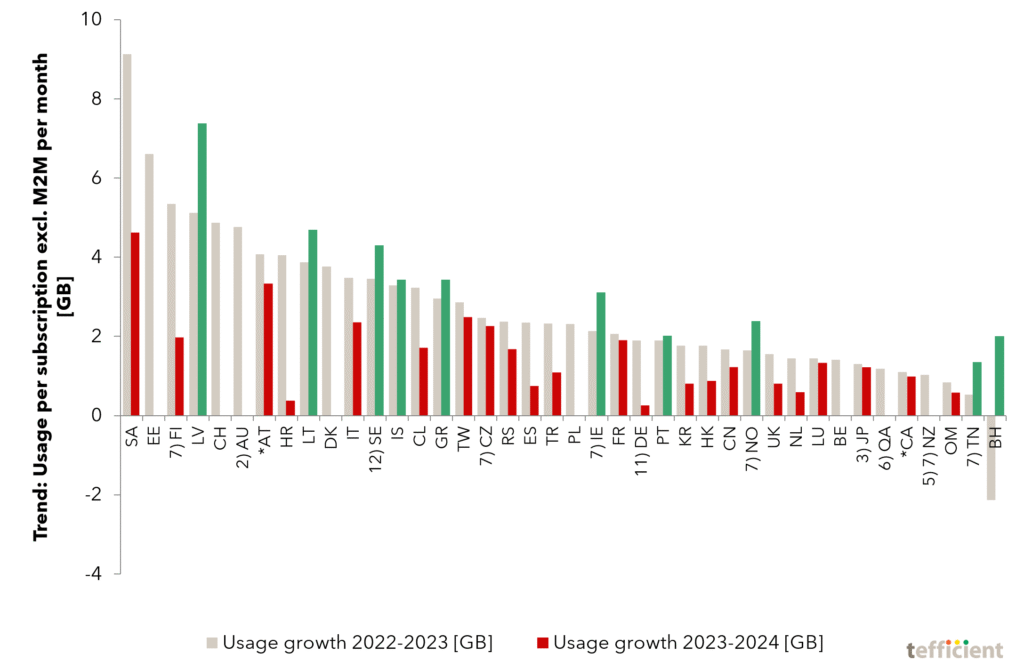
Tefficient’s 44th public analysis compares data from 40 countries, where M2M/IoT can be excluded from the total bases. Mobile data usage grew year-on-year in every country, with Saudi Arabia maintaining its position as the usage leader and Latvia emerging as the new runner-up.
However, growth rates have decelerated. Greece recorded the highest annual increase at 38%, while Croatia posted the lowest at just 2%. Even in absolute terms [incremental GB per subscription], most countries experienced slower growth in 2024 than in 2023. Overall, the demand for additional mobile data is weaker than ever – although FWA is included in most figures.
Data-only subscriptions, while still representing a small share of the market, continue to drive average usage levels. Latvia led with 195 GB per month in 2024. In the pure FWA segment, Australia topped the chart with 469 GB per month in the first half of 2024.
In contrast to data-only subscriptions, the impact of 5G on overall traffic remains limited – except in South Korea, Austria, Saudi Arabia, and Lithuania.
Mobile service revenue per gigabyte continued to decline, though at a slower pace than before. Greece saw the steepest drop at 26%. However, inflation-hit Turkey again saw a surge in revenue per gigabyte. For the first time, three other countries – Oman, Finland, and Croatia – also recorded increases.
Overall, 63% of the markets saw ARPU growth aligned with higher data usage – a softer outcome compared to the previous edition of this analysis.
27 November 2024
Is the end of the S-curve in sight?
Tefficient’s 43rd public analysis of mobile data trends and drivers compares data from 39 countries, where M2M/IoT can be excluded from the total bases. Mobile data usage grew in every country year-on-year, with Saudi Arabia remaining the usage leader.
However, growth rates have decelerated – Greece saw the highest increase at 55%, while Croatia and Finland posted just 5%.
Data-only subscriptions, while limited in market share, continue to define average usage. Latvia led with 164 GB per month in 2023, followed by Austria with 136 GB per month in the quarter of 2024. In pure FWA, Australia led with 469 GB per month in the first half of 2024, followed by Sweden with 316 GB in 2023 and Ireland with 313 GB in the first half of 2024.
Unlike data-only subscriptions, 5G’s impact on traffic remains limited, except in South Korea, Austria, Lithuania, and Saudi Arabia.
Mobile service revenue per gigabyte continued to decline but at a slower pace, with Greece seeing the sharpest drop, 35%. Inflation-affected Turkey, however, again saw its revenue per gigabyte skyrocket. But this time Finland had an increase too – a first-ever for the country.
Encouragingly, 73% of markets saw ARPU growth aligned with higher data usage – a positive outcome in line with our previous edition of this analysis.
3 October 2024
Fewer operators capitalised on pricing power to deliver “more for more”
In Tefficient’s 42nd public analysis of mobile data trends, 123 operators are ranked based on metrics like average data usage per subscription, total data traffic, and revenue per gigabyte.
In 2023, 93% of operators experienced growth in data usage per subscription, with 71% of them successfully converting this into higher ARPU.
This trend continued into the first half of 2024, where 95% of operators saw increased data usage, and 69% managed to translate this rise into ARPU growth.
Compared to last year’s analysis, a lower proportion of operators were able to turn rising data usage into ARPU increases, indicating a reduced ability to leverage pricing power.
This analysis is sponsored by DNA.
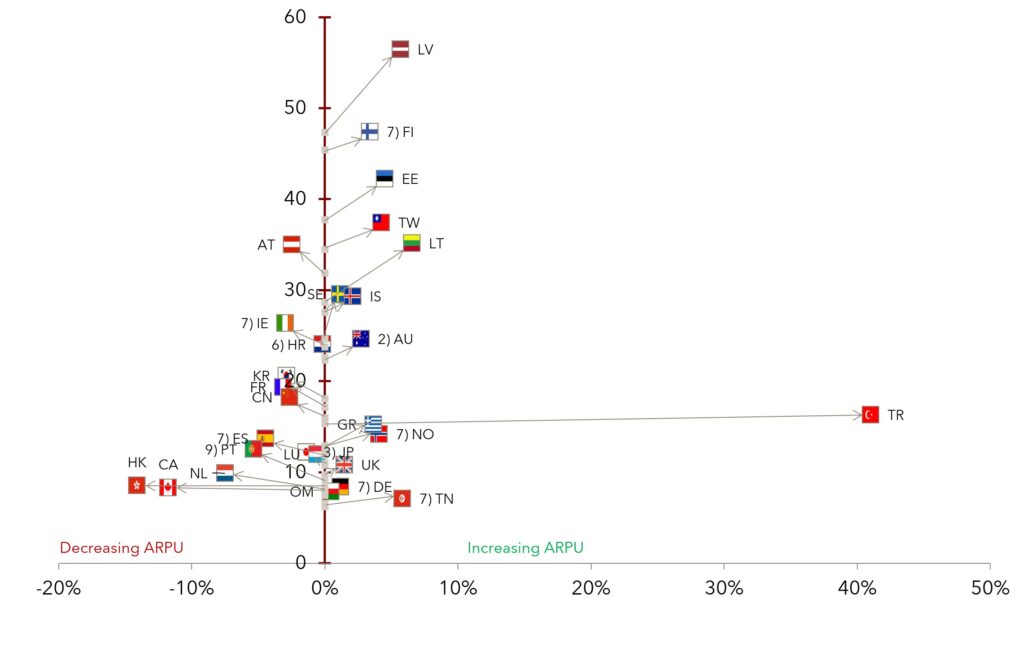
8 July 2024
Change at the top as growth slows
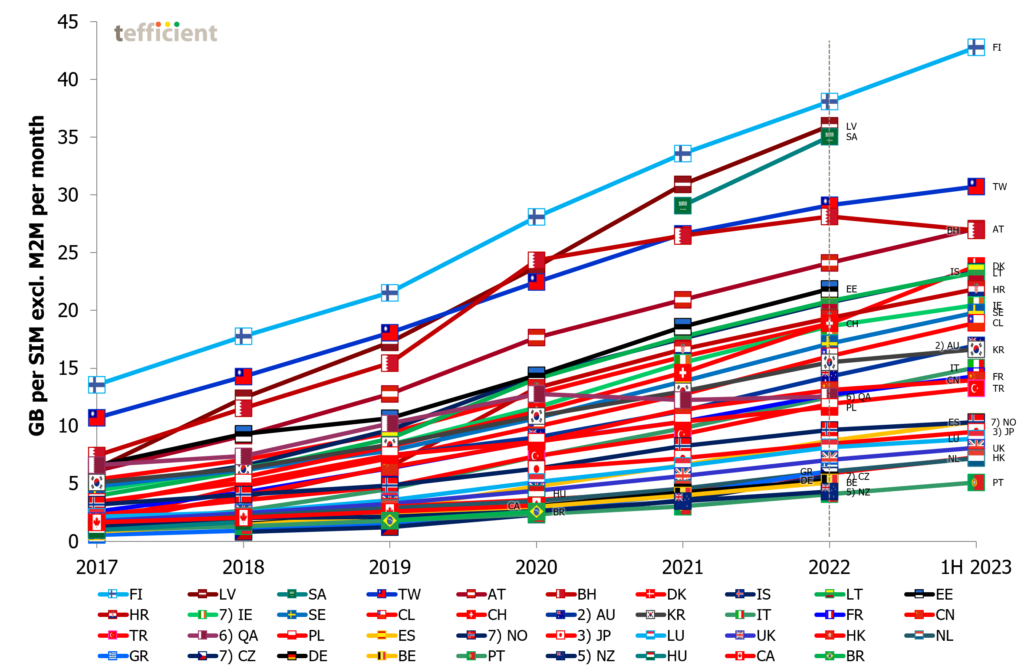
Tefficient’s 41st public analysis of mobile data development and drivers compares 39 countries worldwide, where M2M/IoT can be excluded from the total bases. Mobile data usage grew in 38 of these, with Bahrain as the only exception.
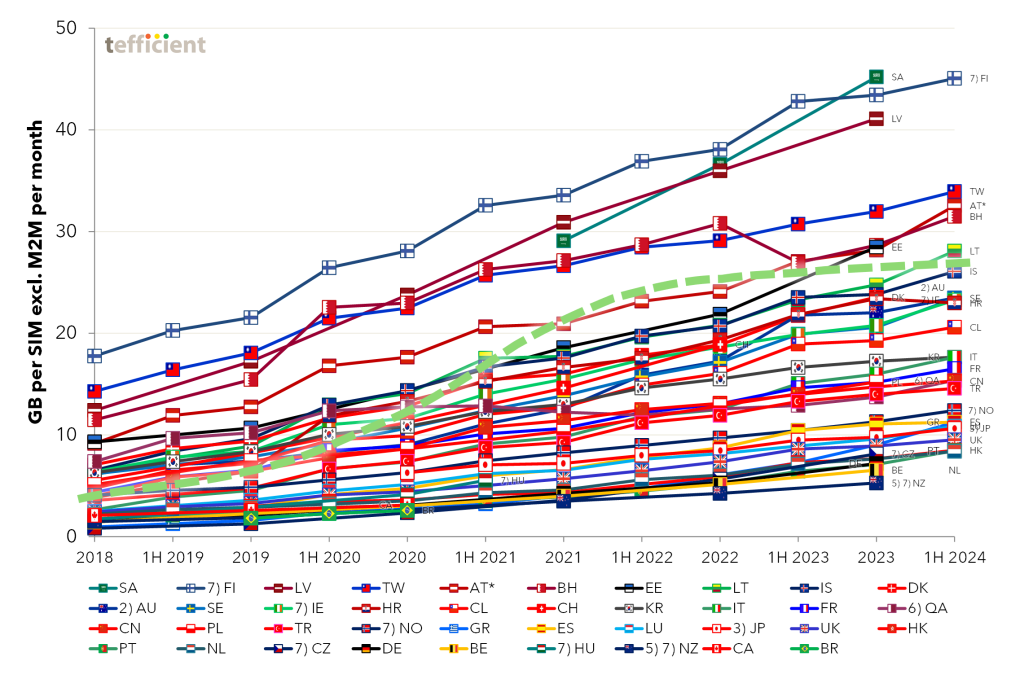
For the first time since 2013, Finland doesn’t lead in usage. Saudi Arabia is the new world leader with more than 45 GB per average subscription in 2023.
When usage continues to grow, the growth rates are slowing. Greece leads with a growth rate of 49%, contrasting with Qatar’s 9% and Taiwan’s modest 10% growth. Bahrain even experienced a decline of 7% in data usage.
Data-only subscriptions continue to dominate average mobile data usage, although their market share remains limited. Latvia‘s average data-only subscription consumed 164 GB per month in 2023. In the FWA-only category, Australia had a high 498 GB per month in 2023.
While data-only subscriptions drive traffic, the same can’t be said for 5G in general. Reporting is imperfect, but only three countries have disproportionately high 5G traffic relative to their 5G bases: South Korea, Austria, and Saudi Arabia. We explain what these countries are doing right and what other countries are missing.
Overall, mobile data revenue once again reached its lowest level, although the decline in revenue per gigabyte slowed compared to our previous analyses. Greece experienced the fastest erosion rate at 31%. Turkey was the only country to witness a much-needed increase.
Adding to the positive outcomes, 70% of markets experienced an increase in ARPU following data usage growth. This is an improvement compared to some of the previous editions of this analysis.
18 December 2023
Human customers subsidise M2M/IoT customers
Tefficient’s 40th public analysis of mobile data development and drivers compares 47 countries worldwide, including M2M/IoT in the total bases. Mobile data usage grew in 44 of them, with Austria, Bahrain and China being exceptions.
When usage grows, the growth rates are slowing. Cyprus, however, had an astonishing growth rate of 123%, in stark contrast to much slower growth rates, or even declines, elsewhere.
Data-only subscriptions dominate average mobile data usage, although their market share is limited. In 2022, Latvia‘s average data-only subscription consumed 138 GB per month. In the FWA-only category, Australia stood out with 334 GB per month in 1H 2023.
While data-only drives traffic, the same cannot be said for 5G in general. Reporting is imperfect, but only three countries – South Korea, Austria and Saudi Arabia – demonstrate disproportionately high 5G traffic in relation to their 5G bases. We elaborate on the strategies adopted by these countries and highlight aspects other nations might be missing.
Overall, mobile data revenue reached its lowest level once again, although the erosion in revenue per gigabyte slowed compared to our previous analyses. Portugal experienced the fastest erosion rate at 30%, while Turkey witnessed a much-needed increase.
Human customers currently subsidise M2M/IoT customers
In 44% of the markets, an increase in ARPU followed data usage growth. This outcome is disappointing, especially given the inflationary backdrop. The result is worse than in our exclusive-M2M analysis. M2M/IoT customers do not contribute to the ARPU growth of operators in a similar way as human customers do. We conclude that human customers currently subsidise M2M/IoT customers, prompting us to wonder why.
15 December 2023
Data-only drives traffic. The same can’t be said for 5G.
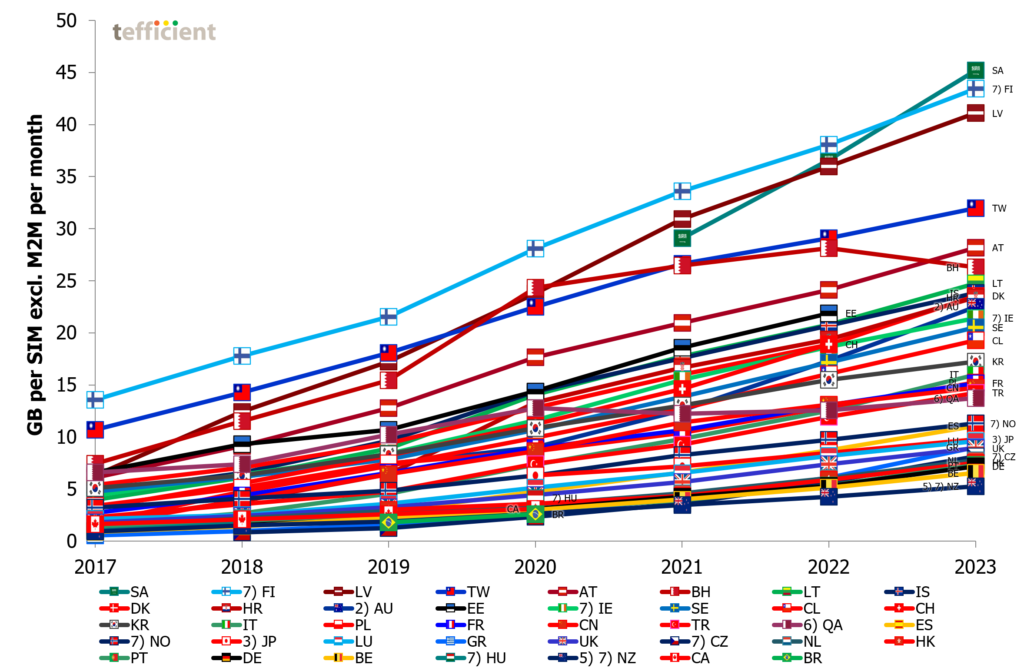
Tefficient’s 39th public analysis of mobile data development and drivers compares 39 countries worldwide, where M2M/IoT can be excluded from the total bases. Mobile data usage grew in 38 of them – with Bahrain as the only exception.
When usage grows, the growth rates are slowing. Portugal leads with a growth rate of 47%, contrasting with Taiwan‘s modest 8% growth. Bahrain experienced a decline of 6% in data usage.
Data-only subscriptions continue to dominate average mobile data usage, although their market share remains limited. Latvia‘s average data-only subscription consumed 138 GB per month in 2022 while Austria recorded 115 GB in the first half of 2023. In the FWA-only category, Australia had a remarkable 334 GB per month in 1H 2023.
While data-only drives traffic, the same can’t be said for 5G
Reporting is imperfect, but there are only three countries with disproportionately high 5G traffic in relation to their 5G bases: South Korea, Austria and Saudi Arabia. We explain what these countries do and what other countries are missing.
Overall, mobile data revenue once again reached its lowest level, although the erosion in revenue per gigabyte slowed compared to our previous analyses. Portugal experienced the fastest erosion rate at 30%. As the sole country, Turkey witnessed a much-needed increase.
73% of markets experienced an increase in ARPU following onto data usage growth
Adding to the positive outcomes, 73% of markets experienced an increase in ARPU following onto data usage growth. However, when accounting for overall inflation, the ARPU growth is still almost always slower than inflation. Things improved, though.
21 September 2023
Mobile operators demonstrate strengthened ability to improve ARPU on the back of data usage growth
Tefficient, in its 38th public analysis of mobile data trends, has ranked 116 operators based on metrics like average data usage per subscription, total data traffic and revenue per gigabyte. This issue covers the full year of 2022 and the first half of 2023.
Notably, 97% of operators witnessed an upswing in data usage per subscription in 2022, with 75% of them successfully translating this into increased ARPU.
The positive trajectory continued into the first half of 2023, as 96% of operators observed a rise in data usage per subscription. Among them, 75% managed to convert this heightened usage into ARPU growth.
Tefficient’s well-known Christmas tree graphs vividly illustrate the operators that experienced ARPU improvements. This shift is significant, signalling a more rational approach by operators, as they leverage their pricing power in various markets.
This transition towards better monetisation of mobile data gains prominence against the backdrop of escalating inflation since spring 2022. This strategic pivot towards an ethos of ‘more for more’ is a timely and advantageous move for operators.
This analysis is sponsored by DNA.
10 July 2023
ARPU growth almost always slower than inflation
Tefficient’s 37th public analysis of mobile data development and drivers compares trends across 37 countries worldwide, excluding M2M/IoT from the total bases.
Previous analyses have shown that the pandemic led to a significant increase in mobile data usage. However, the demand for more mobile data has since slowed down. In 2022, Czechia experienced the highest growth rate in mobile data usage, reaching 59%. At the other end of the spectrum, Qatar and Taiwan had relatively lower increases, both below 9%.
Data-only subscriptions continue to dominate average mobile data usage, although their market share remains limited. In 2022, Latvia‘s average data-only subscription reached 138 GB per month. In the FWA-only category, Australia recorded 286 GB, while Sweden reached 250 GB.
Overall, mobile data revenue once again reached its lowest level, although the erosion in revenue per gigabyte has slowed compared to previous analyses. Greece experienced the fastest erosion rate at 30%, while Turkey witnessed an increase.
Excluding M2M, 71% of markets experienced an increase in ARPU following onto data usage growth, which is a positive outcome. However, when accounting for overall inflation, the ARPU growth is almost always slower than inflation.
2 June 2023
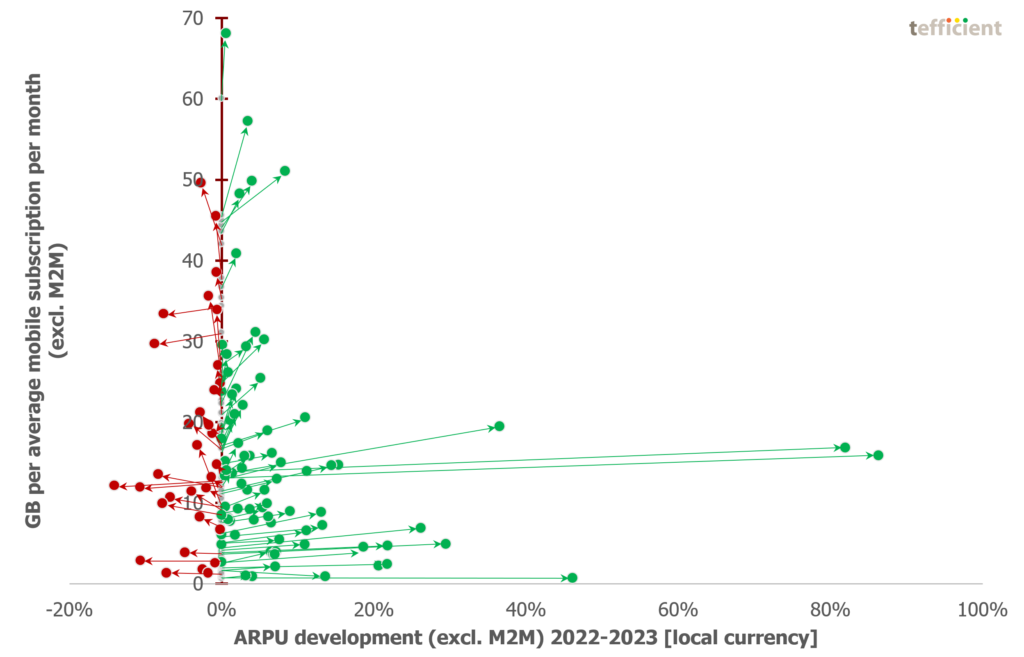
High data usage countries do better on ARPU development than low-usage countries
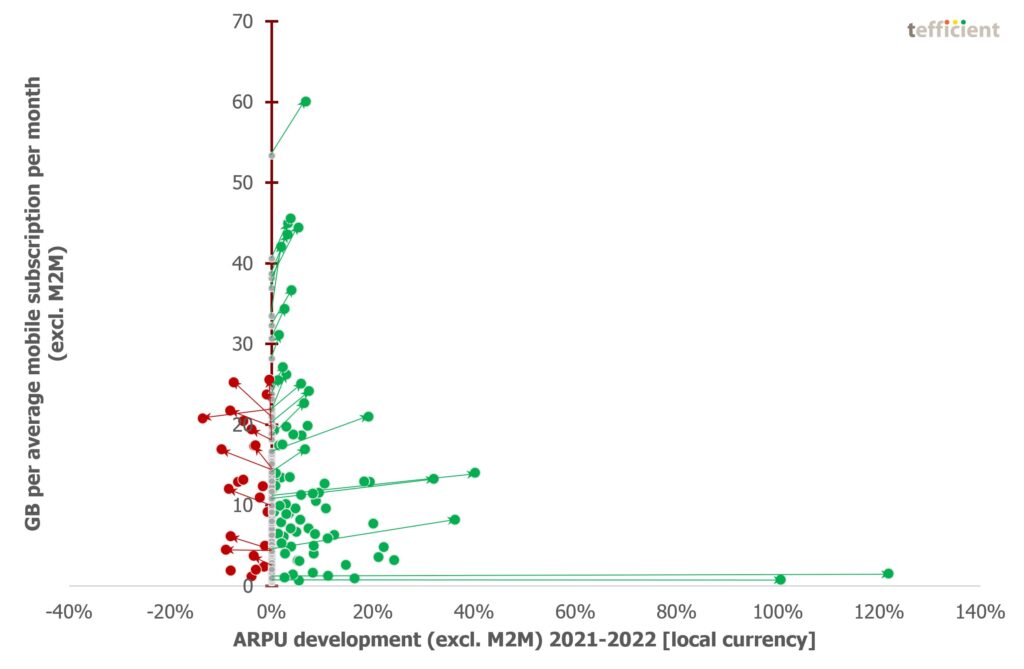
Tefficient’s 36th public analysis of the development and drivers of mobile data compares the trends of 45 countries globally.
In our previous analyses, we saw that the pandemic led to an increase in the mobile data usage. The demand for more mobile data has since slowed. Czechia experienced the fastest growth in mobile data usage in 2022: 56%. On the other end of the spectrum, Iceland witnessed a decrease in usage. Austria, China, Malaysia and Norway had some increase, but it was below 9%.
Data-only continues to define the average mobile data usage although the share of base is limited. Latvia’s average data-only subscription used 138 GB per month in 2022. In the FWA-only category, Australia had 286 GB and Sweden 250 GB.
Overall, mobile data has never been cheaper although the erosion in the revenue per gigabyte slowed compared to previous analyses. Greece had the fastest erosion, 30%, while Turkey and India had an increase.
The positive ARPU development seen in our last-year analysis did not continue in 2022. Usage grew at a slower rate, and a lower share of countries were able to improve ARPU. With high inflation now being present, we had hoped that the ARPU improvement trend from our 2021 analysis would continue.
But we spot something new: The countries doing the best on ARPU development are often high-usage countries. The low ARPU performers are in the low-usage part of our Christmas tree.
27 November 2022
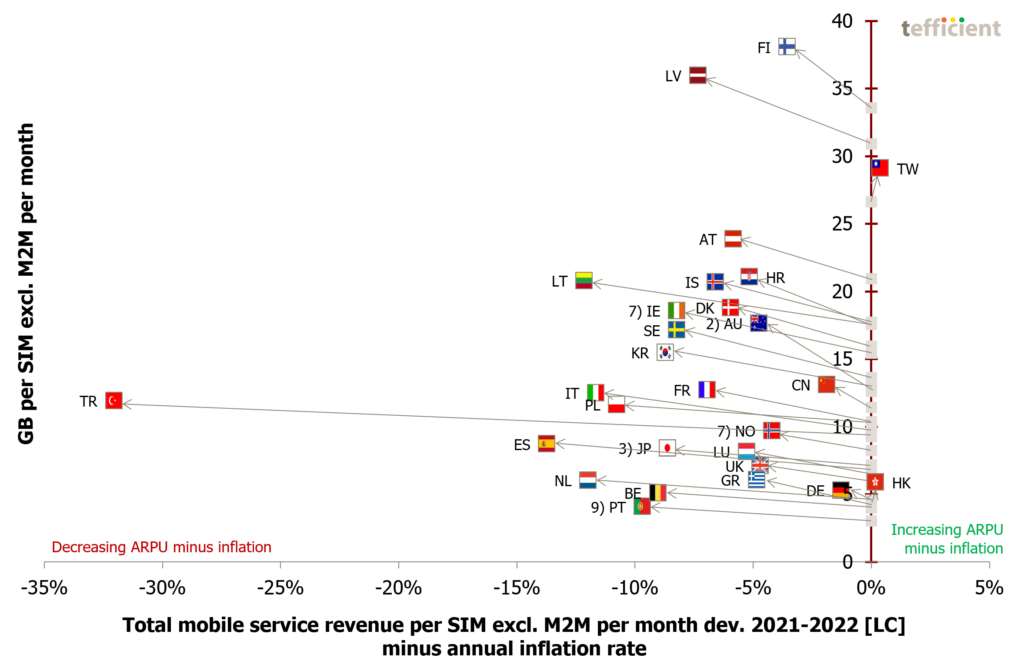
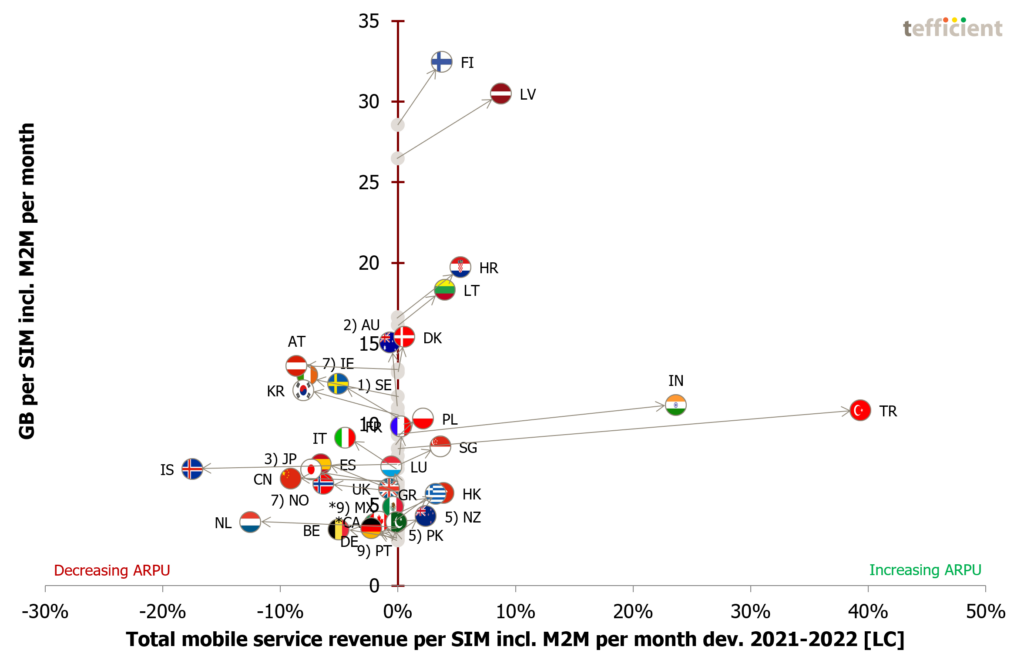
Further slowdown in data usage growth causes positive ARPU development to soften
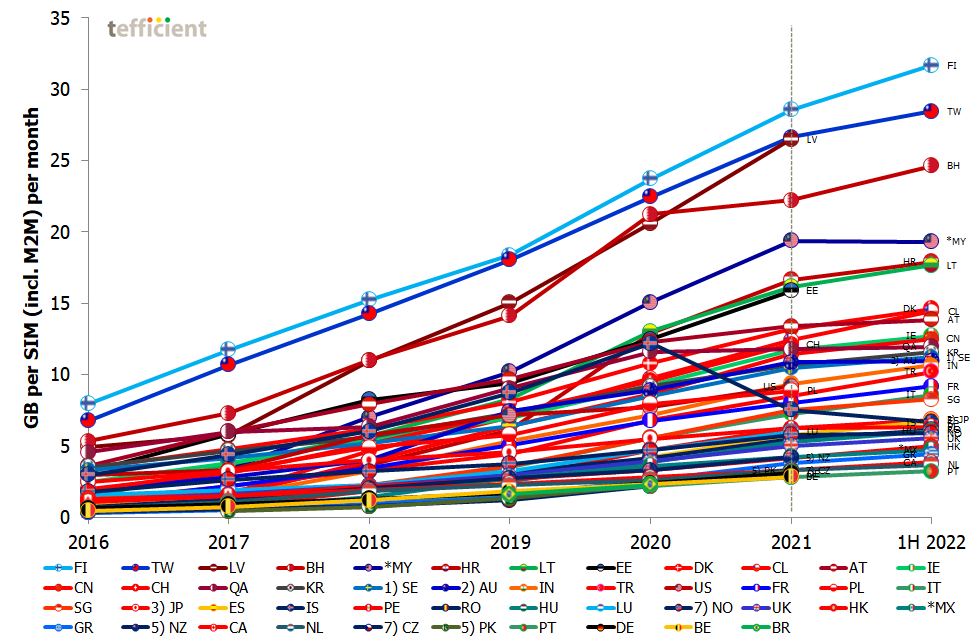
Tefficient’s 35th public analysis of the development and drivers of mobile data compares the trends of 46 countries from around the world. In our previous reports, we observed that the pandemic drove an increase in mobile data usage. However, during the second half of 2021 and into 2022, the demand for more mobile data slowed.
Greece experienced the fastest growth in mobile data usage, with a 45% increase. On the other end of the spectrum, Qatar, Peru, Malaysia, and Austria saw unusually slow growth rates of just 1-3%.
Data-only continues to define the average mobile data usage, although the share of base is limited. Austria became the first country to reach 100 GB per data-only SIM per month, closely followed by Finland.
Overall, mobile data usage has never been cheaper, but the erosion in revenue per gigabyte slowed compared to previous reports. Greece saw the fastest erosion at 29%, while India reported an increase.
The positive ARPU development seen in our previous analysis did not continue in the first half of 2022. Mobile data usage grew at a slower rate, and a lower share of countries were able to improve their ARPU. Given the rising inflation starting in the latter half of 2022, we had hoped that the ARPU improvement trend from our last analysis would continue.
9 September 2022
ARPU improved when the data usage growth slowed down
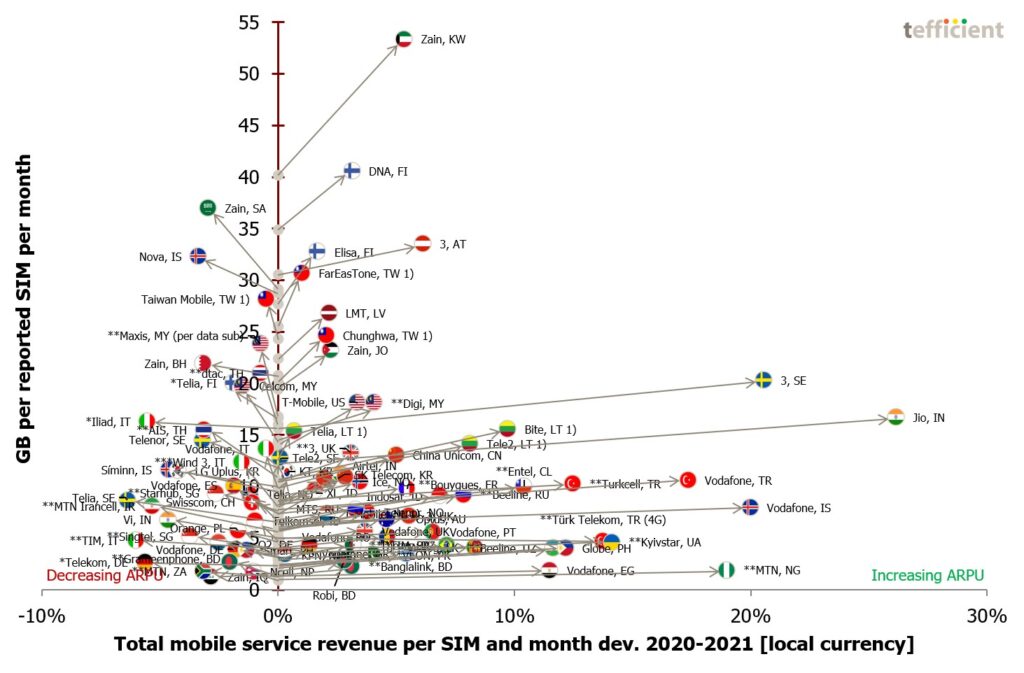
Tefficient’s 34th public analysis on the development and drivers of mobile data ranks 104 operators based on average data usage per SIM, total data traffic and revenue per gigabyte in the full year of 2021 and in the first half of 2022.
In 2021 – a year marked by COVID – the data usage per SIM grew for 97% of operators. The average traffic growth was 32%. A majority of operators, 62%, could turn data usage growth into ARPU growth.
In the first half of 2022, the data usage per SIM grew for 98% of operators. The average annual growth rate in traffic slowed to 27%. But 61% of operators could still turn data usage growth into ARPU growth.
Our famous Christmas tree graphs show how ARPU improved after COVID restrictions were lifted – although usage growth slowed down. In many markets, operators became more rational and started to use their pricing power at the end of 2021.
When the world suddenly faced a quickly rising inflation rate in the spring of 2022, this trend shift became even more important. Operators are lucky to have started the journey towards an improved monetisation of mobile data already before inflation knocked on the door.
This analysis is sponsored by DNA.
17 June 2022
Usage growth decelerates after COVID – but monetisation improves
 Tefficient’s 33rd public analysis of the development and drivers of mobile data compares 46 countries from all regions of the world.
In our previous reports for 2020 and 1H 2021 we could see that the pandemic drove mobile data usage. But the usage backlash is here: During the second half of 2021 the demand for more mobile data slowed. If comparing countries where usage is available for both the first and the second half of the year, most experienced decelerating growth. There were even five countries with a decline in absolute usage: Australia, Iceland, Austria, Qatar and Bahrain.
The country with the fastest growth in usage was – once again – Peru with 53%. Qatar, Bahrain, Austria and Japan experienced unusually slow growth rates of 15% or less in 2021. Iceland even declined when the M2M base exploded.
Using mobile data has never been cheaper but the erosion in the revenue per gigabyte slowed compared to previous reports. It was again Spain that had the fastest erosion, 35%, while Iceland – for the first time ever for a country in this series of analyses – reported an increase.
The good news: ARPU developed much more favourably compared to previous reports. Although mobile data usage grew slower, a larger share of countries could improve ARPU. Our famous Christmas tree graph shows a majority of branches going right. It has not happened in a long time.
29 November 2021
Back to normal? Or will 5G push the envelope?
 Tefficient’s 32nd public analysis of the development and drivers of mobile data compares 46 countries – now with Brazil added.
In our previous report we could see that the pandemic drove mobile data usage – contrary to the belief that all that time we spent at home would offload mobile data traffic to Wi-Fi and fixed broadband. Although the pandemic was still very much present in our daily life, the relaxation of restrictions in the first half of 2021 led to a more normal growth in mobile data usage.
It wasn’t the best timing, but the mobile industry introduced and marketed a new generation of technology, 5G, in the midst of a pandemic. The impact of 5G on mobile data usage could be positive – especially when operators use 5G as a catalyst to reconsider and loosen previous strict policies.
Finland, Taiwan, Bahrain and Latvia continue to lead the world in average data usage per subscription. The fastest growth was in Peru with 53% – far from the 111% growth that Croatia led with in 2020.
Data-only continues to define the average mobile data usage although the share of base is limited.
Using mobile data has never been cheaper but the erosion in the revenue per gigabyte slowed compared to 2020. Spain had the fastest erosion, 37%, and India the slowest; 9%.
How did ARPU then develop? To answer that, we present an updated Christmas tree graph. And we show how 5G helped South Korea’s and China’s operators to move from the wrong to the right side of the Christmas tree.
12 July 2021
Mobile data usage got a boost when we were immobile
Tefficient’s 31st public analysis of the development and drivers of mobile data compares 44 countries from all regions of the world. The pandemic affected us all but although we to a high extent spent the year in our homes, mobile data usage increased in every single country. Mobile data is apparently not just used by people on the move.
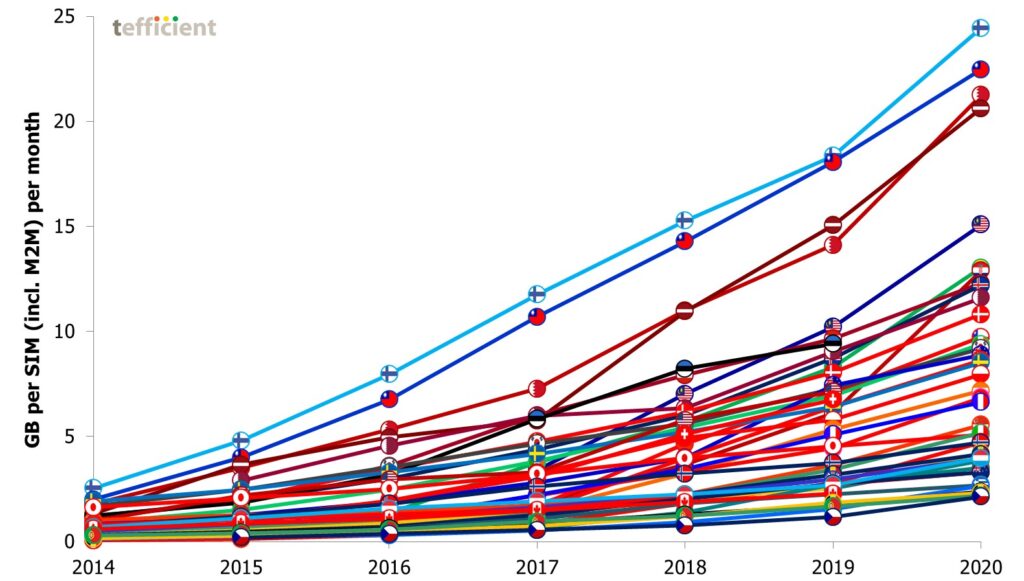
Generally speaking, the growth accelerated in 2020; only a few countries experienced a slower growth rate.
Finland, Taiwan, Bahrain and Latvia lead the world in average data usage per subscription. But with 111%, Croatia leads the world in usage growth. Australia, the Netherlands and New Zealand had the slowest growth. In these countries, home Wi-Fi seems to have offloaded mobile data.
Data-only defines the average mobile data usage although the share of base is limited. This is old news, but we believe that the pandemic fuelled the usage of data-only subscriptions as these often are used as a substitute to fixed broadband. The pandemic drove the overall internet traffic and mobile data-only got its fair share of that.
Using mobile data has never been cheaper but the erosion in the revenue per gigabyte varies a lot between markets. Croatia had the fastest erosion, 53%, and India the slowest with just 5%.
And how did ARPU then develop? To answer that, we present an updated Christmas tree graph.
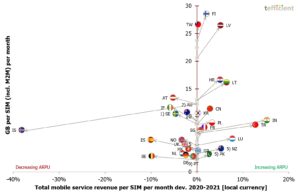
13 April 2021
2020 was a horrific year – but not for the global mobile data traffic that grew 38%
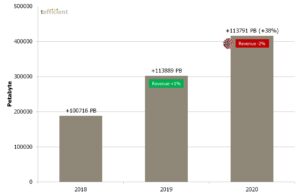 Tefficient’s 30th public analysis on the development and drivers of mobile data ranks 105 operators based on average data usage per SIM, total data traffic and revenue per gigabyte in the full year of 2020.
The data usage per SIM grew for basically every operator. 39% could turn that data usage growth into ARPU growth.
39% is a bit lower than in our previous reports and the pandemic is of course to blame when restrictions and WFH more or less put an end to travelling and commuting and shifted traffic from mobile to fixed networks. But as not all homes have access to fixed broadband – or good enough fixed broadband to support both remote work and remote schooling – mobile data stepped in. 38% global growth in mobile data traffic is actually quite remarkable given the pandemic – and that 39% of operators could grow ARPU in that context is impressive. This analysis names the winners.
39% of operators weren’t enough to keep the overall mobile service revenue from falling, though. It fell 2% in 2020.
7 December 2020
The growth in mobile data wasn’t stopped by a pandemic
 Tefficient’s 29th public analysis of the development and drivers of mobile data compares 44 countries from all regions of the world.
Although a pandemic hit the world in 1H 2020, usage grew in every single country. But the growth was unevenly distributed – some countries grew faster than before while others grew slower than before.
And as a likely consequence of the pandemic, few countries were capable of turning usage growth into ARPU growth? Read on.
Finland, Taiwan, Bahrain and Latvia lead the world in average data usage per subscription. But it is Croatia that leads the world in usage growth; 128% between the first half of 2019 to the first half of 2020. The Netherlands, Australia and Norway had the slowest growth.
Data-only continues to define the average mobile data usage although the share of base is limited. In all but four reported markets, data-only’s share of total traffic grew – a trend that started in 2019, before Corona. We attribute this to FWA.
Using mobile data has never been cheaper but the erosion in the revenue per gigabyte varies a lot between markets. Croatia had the fastest erosion, 58%, and India (!) the slowest, 13%.
2 September 2020
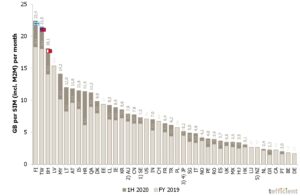
40% more gigabytes in spite of the pandemic
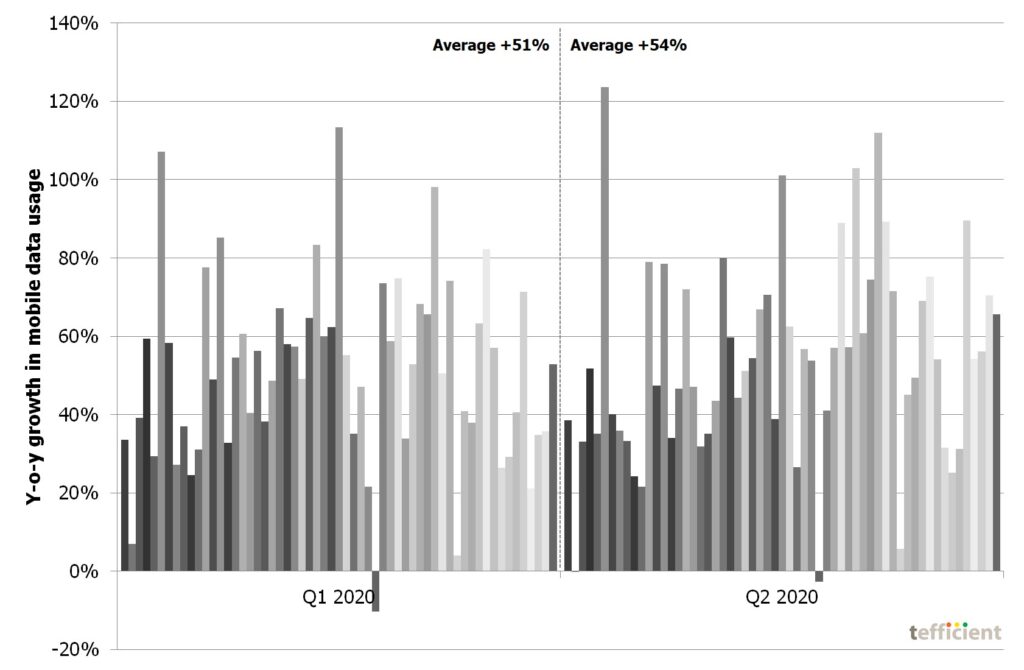 Tefficient’s 28th public analysis on the development and drivers of mobile data ranks 116 operators based on average data usage per SIM, total data traffic and revenue per gigabyte in the first half of 2020.
The data usage per SIM grew for basically every operator. 42% could turn that data usage growth into ARPU growth.
It’s a bit lower than in our previous reports and COVID-19 is to blame; many operators did report negative revenue development in Q2 2020 when travelling stopped and many prepaid subscriptions expired.
Mobile data traffic continued to grow, though: +40%. Although operators in certain markets were giving mobile data away to mitigate the negative consequences of lockdowns, most of the global traffic growth is true, underlying, growth. Data usage actually grew faster in Q2 2020 than in Q1 2020 even though lockdowns mainly affected Q2.
Our industry demonstrated resilience, but now needs to fill the data monetisation toolbox with more or sharper tools.
2 July 2020
ARPU doesn’t follow usage upwards. If we can’t monetise gigabytes, then what?
 Tefficient’s 27th public analysis of the development and drivers of mobile data compares 44 countries from all regions of the world.
Finland and Taiwan continue to dominate the rest of the world in average data usage per subscription. Even though unlimited represents a dominant share of subscriptions here, usage growth rates are modest. It’s instead in Mexico where growth is the fastest. Norway, Sweden, Estonia and Japan have the slowest usage growth.
Using mobile data has never been cheaper but the erosion in the revenue per gigabyte varies a lot between markets. Mexico had the fastest erosion, 50%, and Norway the slowest, 14%.
ARPU grew in only a handful of markets although the gigabyte consumption never been higher. If we can’t monetise gigabytes, then what?
5G helped Korean operators to re-establish growth, but will it help you?
14 April 2020
The gig economy: 58% more gigabytes generated 0.4% more revenue
5G monetisation lessons from China and Korea
 Tefficient’s 26th public analysis on the development and drivers of mobile data ranks 105 operators based on average data usage per SIM, total data traffic and revenue per gigabyte in 2019.
The data usage per SIM grew for each and every operator. 44% could turn that data usage growth into ARPU growth. Identify the skilled minority that delivered on “more for more” in our 33 page deep dive into mobile data monetisation.
In this particular analysis, we take 5G monetisation lessons from China and Korea. Surely 5G could increase data usage – but what happens to ARPU?
3 December 2019
Usage up, but monetisation falters. 5G a chance to level up.
Our 25th public analysis of the development and drivers of mobile data compares 42 countries. Usage grows in every country, but few are able to turn this into ARPU growth. Data-only is making a comeback in many markets.
Finland and Taiwan dominate the rest of the world in data usage per subscription. Even though unlimited dominates, growth rates are modest there. It’s in Mexico, China and Croatia that growth is the fastest. Japan, Sweden and Norway have the slowest growth.
Using mobile data has never been cheaper but the erosion in the revenue per gigabyte varies a lot. China had the fastest erosion, 54%, and Spain the slowest, 13%.
The usage and revenue development in the world’s most advanced 5G market, South Korea, is suggesting that 5G provides a chance for the industry to level up on monetisation.
6 September 2019
Mobile data consumption continues to grow – a majority of operators now rewarded with ARPU
Taiwan: Unlimited is so last year – Korea: 5G boosts usage
 Tefficient’s 24th public analysis on the development and drivers of mobile data ranks 115 operators based on average data usage per SIM, total data traffic and revenue per gigabyte in 1H 2019.
The data usage per SIM grew for all; everybody climbed our Christmas tree. More than half of the operators could turn that data usage growth into ARPU growth – for the first time a majority is in green. Read our analysis to see who delivered on “more for more” – and who didn’t.
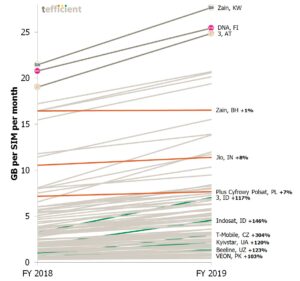
4 July 2019
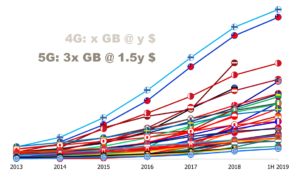
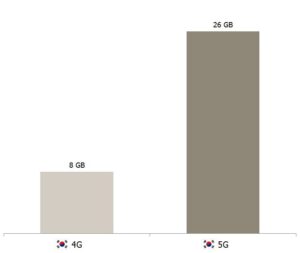
Prepping for 5G: Monetisation model and FWA define usage
 Mobile data usage is still growing in all of the 39 countries covered by this analysis. Two countries stand out – China and India.
But China and India aren’t yet challenging the usage top – where the two unlimited superpowers, Finland and Taiwan, still reign.
Data-only remains a key driver for overall usage and new figures from Czech Republic, Latvia, Finland and Austria add insight to the extreme usage pattern of fixed wireless access.
While 4G’s impact on usage deteriorates, 5G is initially another story. In May, the average Korean 5G subscription used 26 GB of 5G data. During the same month, the average 4G subscription used 8 GB of 4G data.
There is a prerequisite for continued data usage growth, though: The total revenue per gigabyte can’t be too high – like in Canada and Belgium.
29 March 2019
All operators climbed the tree – 46% turned usage growth into ARPU growth
- Which operator has the world’s highest data usage?
- Which operator carries the most data traffic in the world?
- Which operator earns the most – or the least – per GB?
 This is tefficient’s 22nd public analysis on the development and drivers of mobile data. We have ranked 90 reporting or reported operators based on average data usage per SIM, total data traffic and revenue per gigabyte in 2018.
The data usage per SIM grew for all operators; everybody climbed the Christmas tree. 46% of operators could turn that data usage growth into ARPU growth – 54% could not. Read our analysis to see who delivered on “more for more” and who floated with the “more for less” stream.
22 January 2019
China and India shift to 4th gear – leave many mature markets in the dust
 This is Tefficient’s 21st public analysis of the development and drivers of mobile data.
Mobile data usage is still growing in all of the 39 countries covered by this analysis. But there are two countries that stand out – China and India. In the first half of 2018, these two ‘developing’ nations have overtaken several mature markets when it comes to average data consumption per subscription.
But China and India aren’t yet challenging the top – where the two unlimited superpowers, Finland and Taiwan, still reign.
Data-only remain a key driver for overall usage and new figures from Austria and Finland add insight to the extreme usage pattern of fixed wireless access. Since the baby steps on 5G are taken in that FWA segment, it’s an interesting pointer to the future.
But, more importantly, we show the usage vs. ARPU chart.
10 September 2018
More data? Always. For more? It happens.
 Tefficient’s 20th public analysis on the development and drivers of mobile data follows on our country-focused analysis published in July.
In our latest analysis we have ranked 115 operators based on:
- Average data usage per SIM
- Total data traffic
- Revenue per gigabyte
The data usage per SIM grew for all operators. And it grew quickly. But what happened to ARPU? Could operators monetise the data usage growth?
Our Christmas tree graph visualises those that delivered on “more for more” – and those that are just followed the “more for less” stream.
10 July 2018

Tefficient’s 19th public analysis of the development and drivers of mobile data shows that mobile data usage is still growing in all of the 36 countries covered by this analysis. Unlimited moves the needle. Finland tops the charts – but it’s India that leads the growth league.
Data-only is a very important driver of usage. Austria is now the clear world leader in fixed-line substitution. In Korea, the share of data traffic on 4G has now effectively reached 100% with a 4G penetration of 80%. The country is ready for 5G.
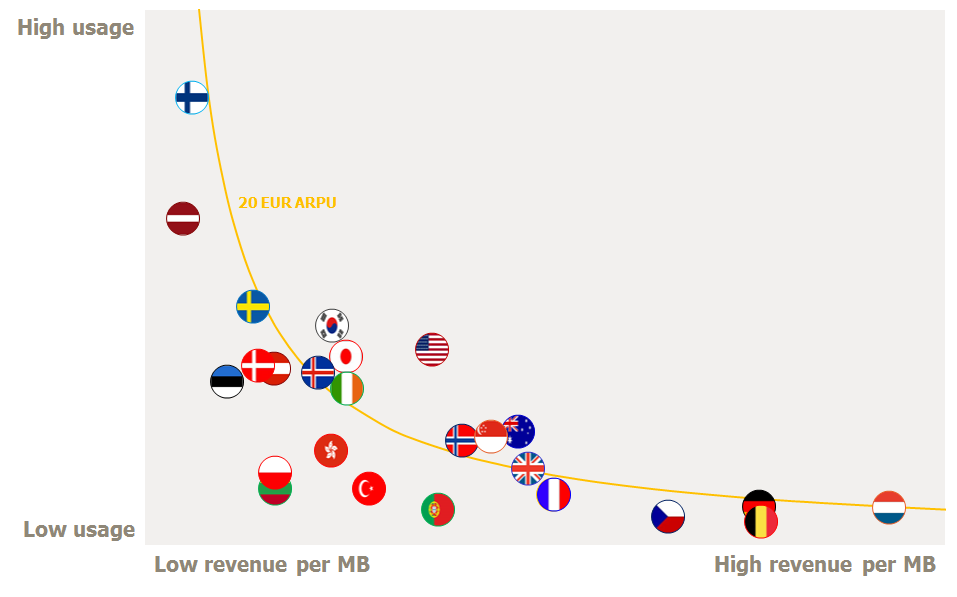
A prerequisite for continued data usage growth is that the total revenue per gigabyte is low. This is not the case in Greece, Canada and Belgium. The total revenue per gigabyte there is roughly 20 times higher than in Finland and more than 35 times higher than in India.
In this analysis we identify the ten countries where the more-for-more initiatives of operators buck the general more-for-less trend.
21 December 2017
Spotting the operators capable of monetising the data usage growth
 Our 18th public analysis on the development and drivers of mobile data ranks 124 operators based on average data usage per SIM, total data traffic and revenue per gigabyte.
The data usage per SIM grew for all operators. But what happens to ARPU? In an upfront way, our new Christmas tree graph visualises the operators that are delivering on more-for-more – and those that are just following the more-for-less stream.
19 December 2017
“More for more” tips the balance
 Mobile data usage is still growing in all of the countries covered by this analysis. The growth rates are very different and so are the usage levels. Finland tops the charts in usage – but not in growth.
Data-only is a clear driver of usage. Austria emerges as the fixed-line substitution leader.
A prerequisite for continued data usage growth is that the total revenue per gigabyte is low. This is not the case in Greece, Canada, Belgium, Germany and Czechia. The total revenue per gigabyte here is roughly 20 times higher than in Finland. Of these countries, Canada stands out with its combination of low data usage and high ARPU.
In this analysis we introduce the Christmas tree visualisation to see where the more-for-more initiatives of operators can balance the more-for-less erosion.
13 July 2017
The luxury of the commodity gigabyte
 This is an add-on to our just-published analysis “More for more” isn’t happening which compares 33 countries.
In this analysis we compare operators. We have ranked 111 of them based on:
- Average data usage per customer
- Total data traffic
- Revenue per gigabyte
If you think gigabytes are becoming a commodity, you are just partly right. End-users love what they can do with data – but even if they are willing to pay for it there are limits to their loyalty.
11 July 2017
“More for more” isn’t happening

The mobile data usage continued to grow in 2016, but the spread in growth rates has never been greater between markets.
Singapore, Japan, Hong Kong and, surprisingly, USA grew the slowest whereas Poland, Lithuania, Romania, Austria and France grew the fastest.
See the top 33 of the world in our 15th analysis of data usage and revenue. See what data-only and 4G LTE means for usage.
And see who has the highest – and lowest – revenue per gigabyte and per SIM.
19 December 2016
Unlimited pushes data usage to new heights
 The mobile data usage continued to grow in 2016, but the growth rates varied much. Singapore, Japan, Hong Kong and Hungary grew the slowest whereas Lithuania, Turkey, Austria and Korea grew the fastest.
In Lithuania, Austria and Korea, premium unlimited plans were introduced and the effect on data usage has been similar to what our previous analyses identified for Finland and Latvia.
The data usage top list is dominated by operators that offer unlimited: The world leader had an average usage per SIM of 9.9 GB per month.
26 September 2016
Upsell and loyalty strategies of operators: Using public Wi-Fi as customer magnet
 In this analysis – our fifth on the subject – we show how telcos, cellcos and cablecos in mature markets in Europe, America and APAC use public Wi-Fi to attract and retain customers – and to upsell.
We also update you on Wi-Fi usage and deployment. You might be surprised to see that the wide adoption of 4G LTE and an increasing use of mobile data meant more Wi-Fi, not less.
29 June 2016
USA, Latvia and Finland combine: High mobile data usage with fast growth
Which country had the highest mobile data usage in 2015? The fastest usage growth? The lowest and highest revenue per Megabyte? How does it affect usage? How are data-only and 4G LTE adoption rates affecting usage?
Which operator leads the world?
Find the answers to these mobile data usage and monetisation questions in tefficient’s 13th public analysis on the topic.
28 January 2016
Wi-Fi – the last piece of the customer retention puzzle?

Why should an operator complement their customers’ experience of mobile data with Wi-Fi?
To improve customer loyalty?
This analysis – covering 22 mobile operators in 7 markets (Belgium, Canada, Switzerland, Taiwan, Japan, Netherlands, Sweden) – makes an attempt to once and for all conclude if Wi-Fi is the last piece of the customer retention puzzle.
21 January 2016
5 GB per any SIM and month no longer a utopia – if price is right
Which operator is in the top when it comes to mobile data usage?
Which country charges the most for mobile data?
https://twitter.com/tefficient/status/690071438460633088
Find the answers to these and other important mobile data usage and monetisation questions in tefficient’s 12th public analysis on the topic.
24 June 2015
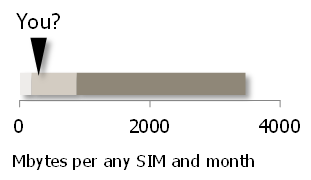
Mobile data usage: Price and bucket size matter
Mobile data usage continues to grow: +58% for the markets in this analysis.
In some high usage markets like the US and Singapore, we however see signs of saturation with growth of just about 20%. But it’s not a general trend: In other high usage markets – Finland, Estonia, Denmark, Japan and Ireland – the mobile data usage grew 60 to 80%.
In the two low usage countries Germany and the Netherlands a Mbyte effectively costs 11-14 times more than in the European countries with the lowest effective Mbyte price.
11 June 2015
Increase loyalty. Increase revenue. Reduce SAC/SRC. Is the combo possible?
Decoupled, non-binding, unsubsidised: A game changer?

Our analysis shows that mature market mobile operators on average use 15-20% of service revenue on subscriber acquisition and subscriber retention cost (SAC/SRC). In most cases without growing.
Consequently, we examine the success of the operators who – in order to reduce SAC/SRC and improve margin – are challenging the mature market norm with binding contracts with coupled, subsidised, equipment.
22 December 2014
For the first time – in our 10th public analysis on the development of mobile data usage –we see clear signs of saturation.
Unlimited squeeze-out. Smartphone penetration levelling out. 4G is mainstream. Public Wi-Fi disrupts.
Are we approaching “peak data”?
8 December 2014

How operators use Wi-Fi to strengthen existing business
Wi-Fi has become a tool in the operator toolbox. In this analysis – our third on the subject – we show how telcos, cellcos and cablecos use Wi-Fi to strengthen existing business.
Time is right for operators to include Wi-Fi into a combined connectivity experience for customers – a carrier-grade experience.
8 September 2014
 Early upgrade plans: Sweet now. Turns sour?
Is a recurring upgrade promise – often without any fee – a good idea? Take-up has been great, but it’s only now the pioneering operators need to start delivering on this promise.
19 June 2014
 Mobile data usage: Global top list
For the first time, we have combined regulator reported data with operator reported data from around the world allowing comparisons between markets as well as in markets. We also present a new number 1 on the country top list.
19 May 2014
 Impact of operator sub-brands on MVNO businesses
What happened to the MVNO businesses when Orange, SFR and Bouygues launched their sub-brands Sosh, Red and B&YOU in preparation for the announced launch of Free mobile.
21 March 2014
 The art of balancing SAC and SRC
This is our fourth analysis on subscriber acquisition cost (SAC) and subscriber retention cost (SRC). It shows that much has happened in 2013: Average unit SAC and SRC have decreased significantly. How come – and what has it led to?
Some of our older analyses are still available:
Why more operators should care about alternative smartphone OSs 30 January 2014
Mobile data usage: The global top list 18 December 2013
How 4G LTE became mainstream (for some) 15 November 2013
Invest – and conquer? 8 October 2013
How six months contracts changed mobile in Belgium and Denmark 13 September 2013
Why the smartphone growth is over (for smartphones as we got to know them) 23 August 2013
From four to three operators: The quick fix of a broken market? 12 August 2013
Quad-play: A competitive necessity? 5 July 2013
Mobile data demand saturated? Forget it. 16 June 2013
Top MBoU operators worldwide 10 June 2013
Top LTE operators worldwide 31 May 2013
Top FTTH/B operators worldwide 24 May 2013
Operator Wi-Fi booms 14 April 2013
Why operators should refrain from handset sales 27 March 2013
SRC increases to 98% of SAC – do the positive effects continue after 100%? 11 March 2013
Why mass marketing is inefficient when launching LTE 4 March 2013
Time for Korea and Estonia to harvest 12 February 2013