
The fourth quarter has traditionally been the most difficult for mobile operators in mature markets. Many customers join, but many others are leaving and operators typically dilute margins by having more equipment (and more expensive equipment) in the sales mix compared to the rest of the year.
Subscriber acquisition and retention costs are generally higher in the fourth quarter when the financial discipline of mobile operators is put aside to promote equipment at prices well below the operator purchase costs – as long as existing customers promise to stay or new customers are ready to commit to plans with high monthly fees.
 But even though there are temporary setbacks, our industry is gradually moving in a more rational direction: Equipment subsidisation is less frequent today and many operators have stopped binding customers to long, inflexible, contracts. Mobile operators have developed their service offerings and are today capable of explaining why customers should stay – without having to throw in a new iPhone as part of the package.
![]() In our Nonstop Retention® benchmark, we have identified thirty such reasons to stay:
In our Nonstop Retention® benchmark, we have identified thirty such reasons to stay:
- Inclusive value – e.g. content or roaming
- No waste of data through unlimited, rollover or sharing
- Contract freedom & fairness with price promises, equal treatment of new and existing customers, up- and downgrades
- Buying experience and rating through simplicity, easy terms and conditions and public ratings
- Community & following via referral or loyalty programs and active presence on social media
- Handset flexibility via upgrade options, trade-in or leasing.
Binding customers isn’t an option.
Best trend
And as mobile operators get better at packaging services and communicating the benefits of their services, also the customer loyalty improves. The first graph below shows how the blended mobile churn developed from 2015 to 2016 for 41 reporting operators (click to enlarge).
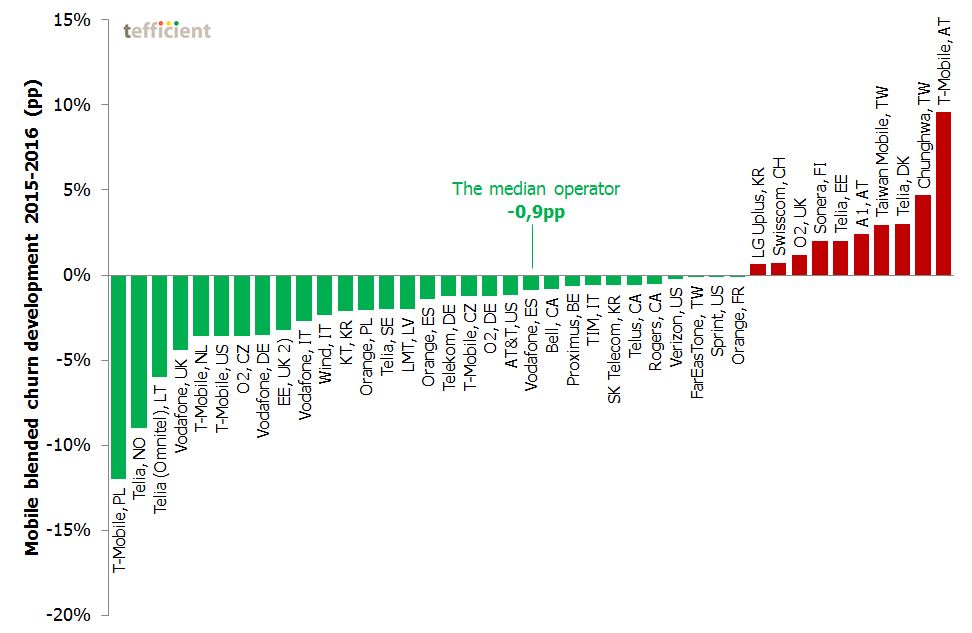
The majority of operators had a positive development of blended churn from 2015 to 2016. The annual blended churn rate of the median operator improved 0,9 percentage points (pp) in 2016.
Some operators are also reporting postpaid churn. Our second graph shows how the mobile postpaid churn developed from 2015 to 2016 for 39 reporting operators.
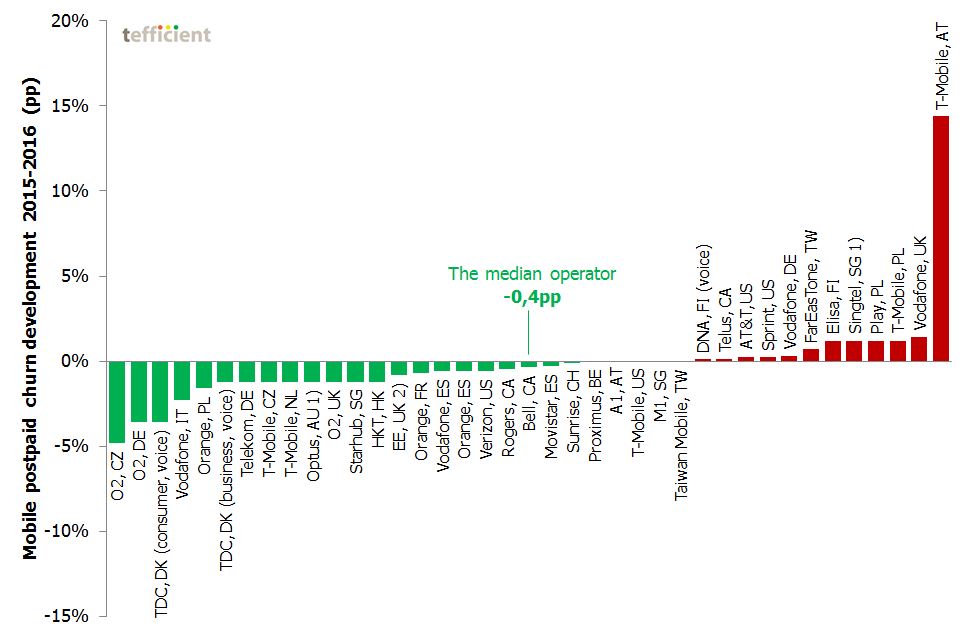
The majority of operators developed favourably: The annual postpaid churn rate of the median operator improved 0,4 percentage points in 2016.
Contrary to the overall positive trend, mobile operators in e.g. Austria, Poland, Taiwan and Finland have generally had a negative churn development in 2016. In at least the first three countries, the markets have been quite volatile in 2016 and the latest entrants (3, Play, T Star) have been quite aggressive, but also successful.
![]() T-Mobile Austria tops both of our two charts – having had the most negative development of churn. T-Mobile chose to make changes to existing plans – which, according to Austrian legislation, left existing customers with the right to churn. Which they apparently also did.
T-Mobile Austria tops both of our two charts – having had the most negative development of churn. T-Mobile chose to make changes to existing plans – which, according to Austrian legislation, left existing customers with the right to churn. Which they apparently also did.
Lowest churn
Let’s leave the churn trends and instead compare the actual churn levels, starting with blended:
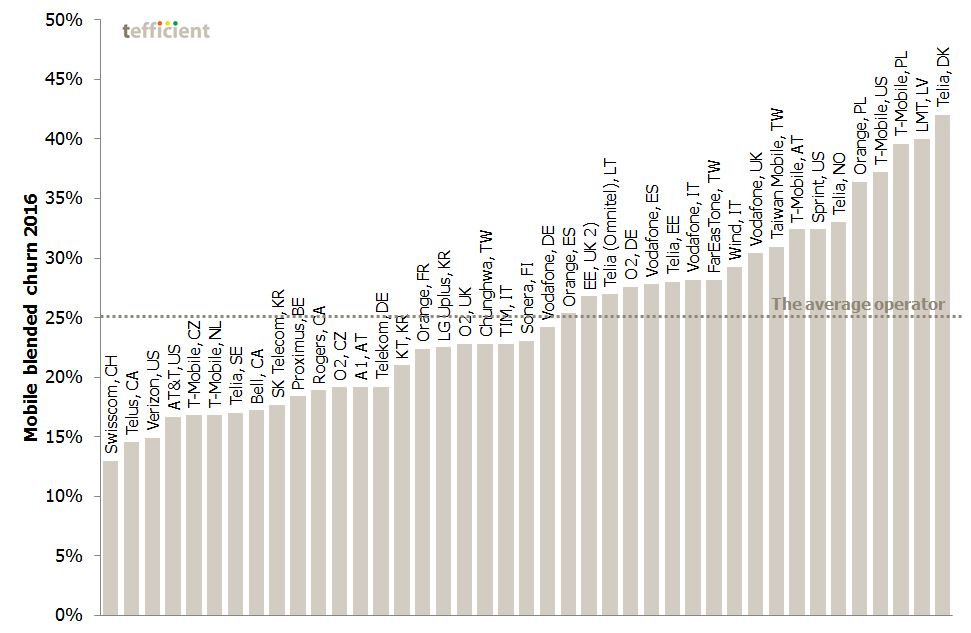
![]() Swisscom‘s blended churn developed negatively in 2016, but the company’s absolute churn level is still very low: Last year only 13% of Swisscom’s customers left the company. In 2016, the average mature market operator lost 25% of its total customer base.
Swisscom‘s blended churn developed negatively in 2016, but the company’s absolute churn level is still very low: Last year only 13% of Swisscom’s customers left the company. In 2016, the average mature market operator lost 25% of its total customer base.
If we instead compare the postpaid churn rate, the absolute numbers are lower overall:
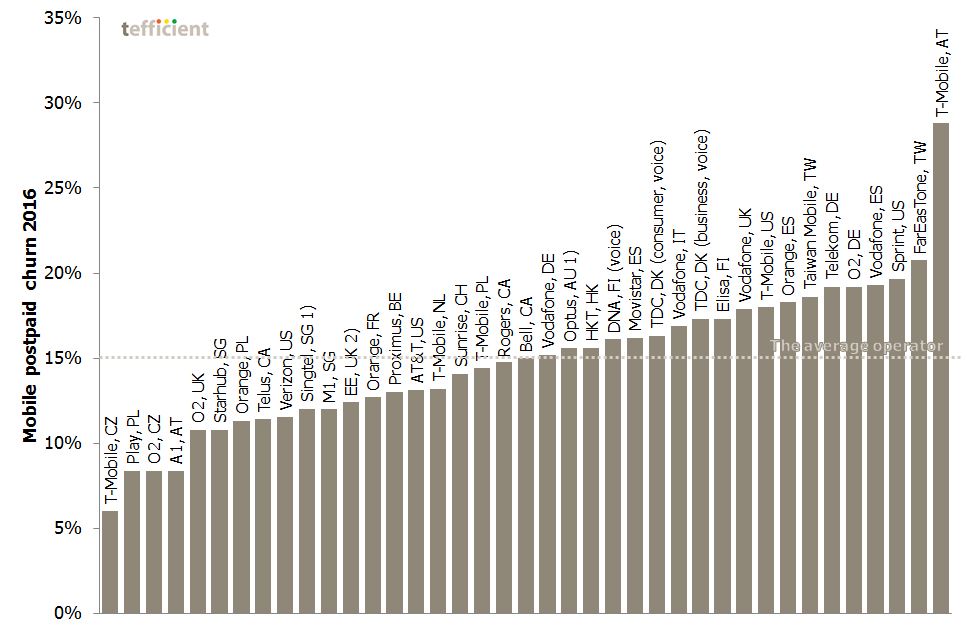
The operator with the lowest postpaid churn rate is T-Mobile in Czech Republic: Only 6% of postpaid customers left during 2016. The average mature market operator lost 15% of its postpaid customer base in 2016.
When will customers start loving the mobile operators?
It says something about our industry when losing 25% of customers every year is considered a step forward. We still have a long way to go before mobile customers love their selected mobile operators and actively exercise their freedom to stay.
 But we think the tools in the toolbox are sharper than before and that the trends are encouraging. Now it’s more about daring.
This is your acid test: Do you dare to stop binding customers to service contracts? If the answer is no – if you actually think your customers would leave you – we encourage you to ask yourself “why?”.
Engage with us to get a Nonstop Retention® benchmark done for the mobile players active in your country. It will give you the insight and attention you need. www.nonstopretention.com