
This blog is a follow-up on Tefficient’s recently published mobile data usage and revenue analysis of operators
When you use a mobile network, your traffic has to co-exist with traffic generated by other users currently connected to the same cell. Your speed experience will depend on how much and what type of traffic those other users generate. It will also depend on how your operator has dimensioned that cell, i.e. how many carriers they have put up. Ultimately that depends on the available spectrum your operator has access to.
When operators want to convince us how great their networks are, they typically talk about download speed, i.e. how many Mbit/s users on their network averagely get when downloading something from the internet. It is being supported by a number of independent network performance specialists – Tutela, Opensignal, Ookla, P3, RootMetrics – issuing country reports naming winning networks.
These reports are actually often multi-faceted with several performance metrics, but that is often too complex to use in marketing, operators think. The simplified marketing message becomes: Speed is good – and we won.
Here are a few recent examples:
We have the fastest network!

Nous sommes fiers de vous offrir l’internet mobile le plus rapide. https://t.co/ru5mZ2oshT
— Proximus (@proximus) March 29, 2019
Proximus Belgium 29 Mar 2019

Some operators tend to highlight – especially at times when they do not win the speed trophy – that download speed doesn’t equal network performance and that a multitude of KPIs need to be considered; coverage, upload speed, latency, jitter and packet loss – to understand who actually has the best network. That is true. But operator marketing as in the examples above simply shouts out: Speed is good. Speed matters.
So with this, we reckoned we needed to figure out what effect data usage has on speed. Since capacity is shared, the fastest networks are perhaps fast because they aren’t used?

We reached out to Tutela, asking them if they could share download speed data with us for all of the 90 operators that we have managed to calculate mobile data usage for. And they did.
Our first attempt to correlate mobile data usage with speed for these operators resulted in a pretty hopeless chart. The average usage per SIM is on the vertical Y axis and the downlink throughput on the horisontal X axis.
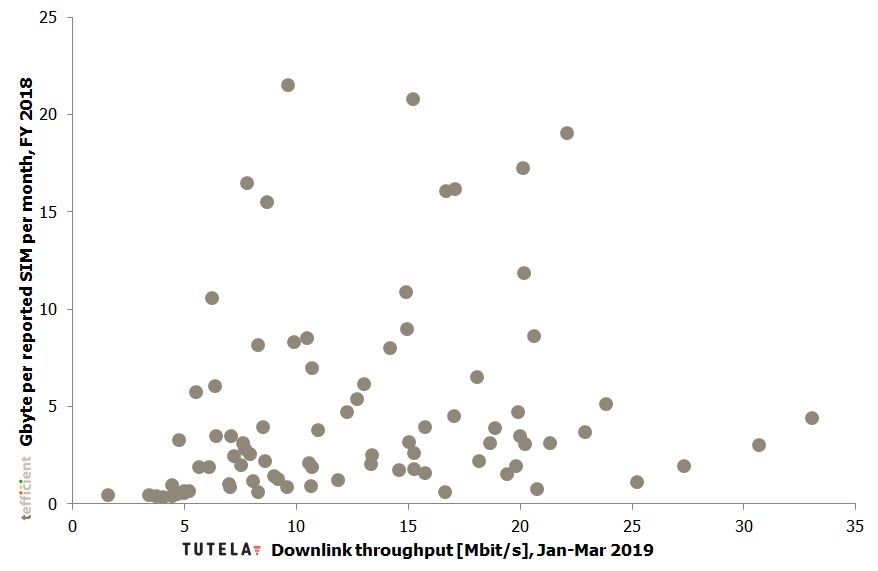
If anything, the chart shows that the downlink throughput increases with average data usage. That’s really not in line with the notion that capacity is limited and shared. Roughly half of the operators are active in maturing markets and for these we realised that GDP has a major impact on the data usage. In maturing markets with higher GDP, data usage is higher, customers therefore pay more for their subscriptions and networks are faster – most likely because operators in maturing countries with higher GDP have had the financials to invest more. But macro-economics was not what we wanted to test.
Hence we separated the operators into two categories: Maturing market operators and mature market operators. The mature market graph got a different look than the overall graph:
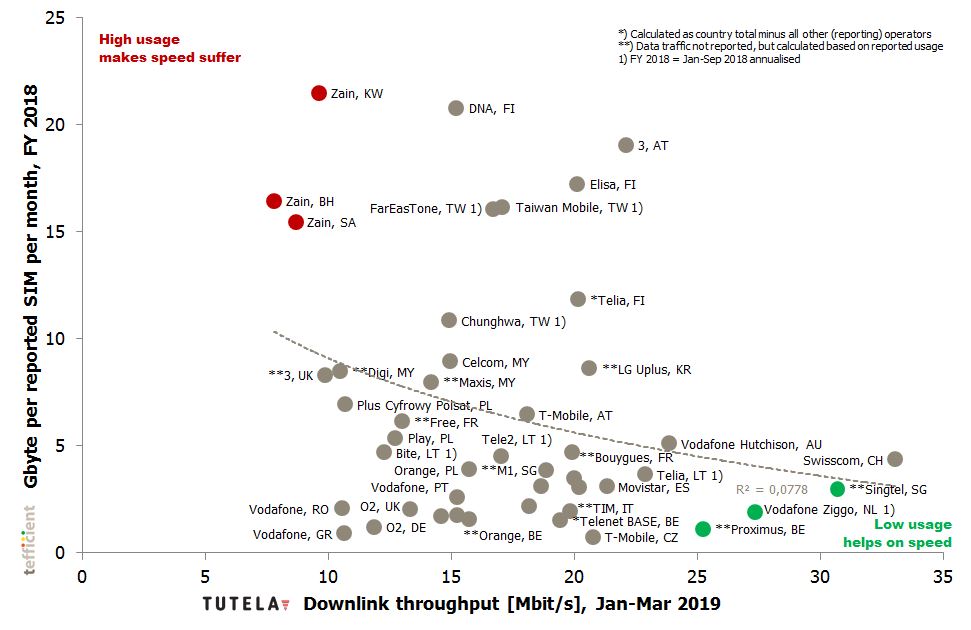
The adherence to the regression line isn’t perfect; the R-square value is far from 1, but by putting the names of the operators onto the chart, we started to think that we could trust it: The operators to the left tend to have high average data usage but low speed – while the operators to the right tend to have low-medium data usage but high speed.
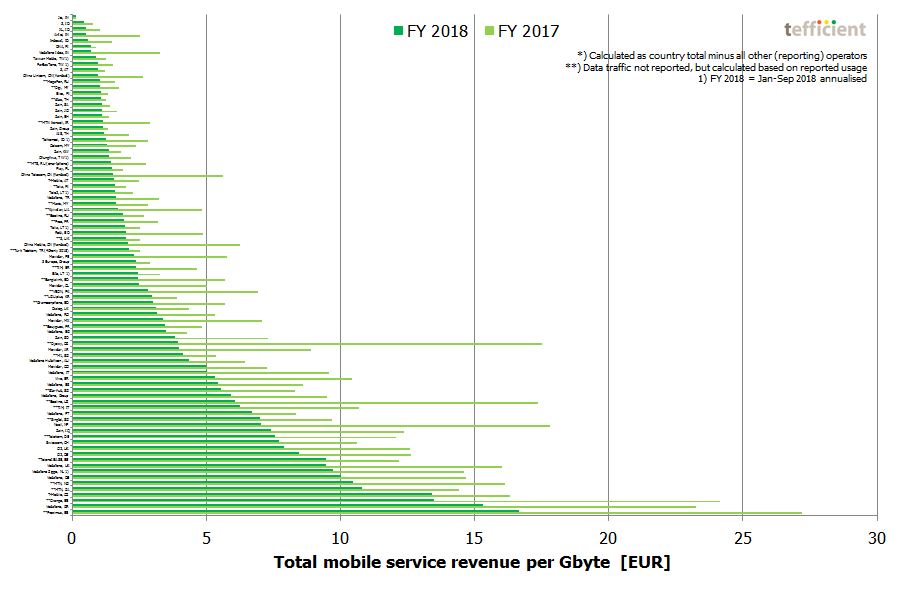
Low usage helps on speed: The green operators tend to be from markets where operators casually win global speed tests – Belgium, the Netherlands and Singapore. These are also markets where data usage is capped by price: Operators in these markets are ranked high in our ‘revenue per consumed GB’ top list in our analysis (Figure 11).
Also Swisscom has a history of winning speed trophies but we refrained from colouring it green as the average data usage actually is quite high. Swisscom has, alongside the Finnish operators, been a European pioneer in speed-tiered unlimited data.

High usage makes speed suffer: In the upper left corner we find the red operators – three affiliates of Zain which all feature very high data usage. Note that Zain’s revenue per GB, in spite of high GDP, is among the lower in Figure 11 in our analysis.
3 UK, Digi from Malaysia and Plus from Poland could perhaps also been coloured red as their high average data usage seems to affect the speed. We refrained from putting red colour on the Finnish operators as the unlimited subscriptions here are speed-tiered, meaning that the measured speed isn’t necessarily due to limitations in the network; a share of Finnish customers have not been willing to pay for more than for a limited speed.
Should we look at speed difference instead?
But rather than looking at the average speed, we should perhaps look at the difference in speed? Since customers tend to use the network at the same peak hours (and not during off-peak), high usage would perhaps demonstrate itself through a larger differential in peak vs. off-peak speed?
In the graph below, peak is defined as 1:00-11:00 pm (13:00-23:00) and off-peak 1:00-5:00 am.
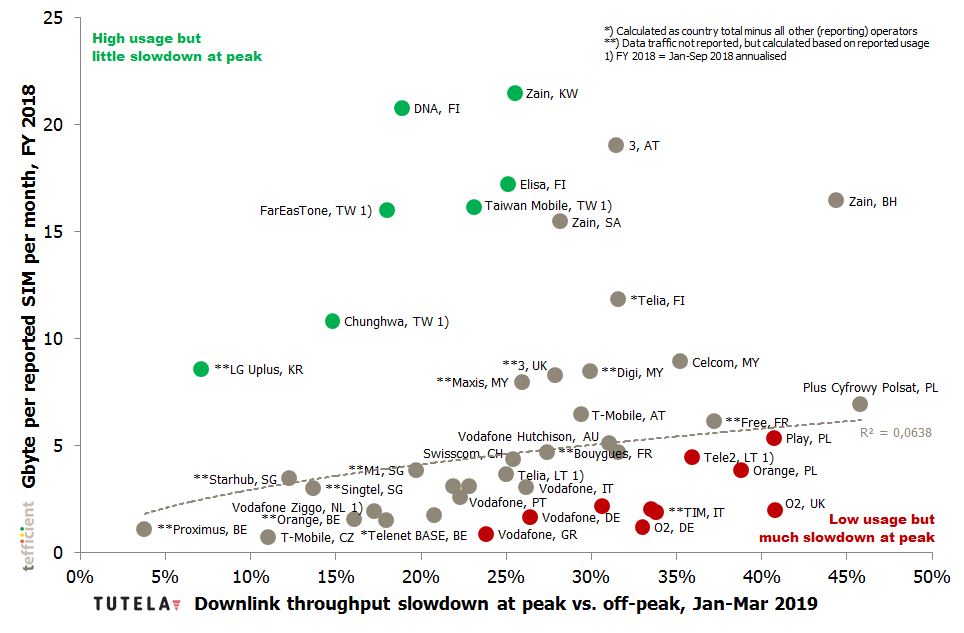
We are again dealing with a far-from-perfect adherence to the regression line, but we still think this graph is interesting with the operator names put onto it.

The first position we’d like to highlight is the bottom-left one of Proximus – the operator in our analysis with the highest total revenue per GB consumed. The average data usage of Proximus is very low – and the network users are hardly experiencing any slowdown (4%) during peak.
High usage but little slowdown at peak: The green operators are all having very high data usage. We are impressed by the position of LG Uplus: That network is only slowing down 7% during peak, but the average data usage is 8 times that of Proximus. Also DNA and Elisa from Finland, the Taiwanese operators FarEasTone, Chunghwa and Taiwan Mobile and Zain from Kuwait seem to keep peak speeds up in spite of very high average data usage.
Low usage but much slowdown at peak: In the other corner, we find the red operators. With the relatively low usage of these operators, they should be able to keep the speed up during peak hours. The two O2 networks in the UK and in Germany seem particularly load sensitive.
So, are fast networks fast because they aren’t used?
To some extent, it seems to be the case. But there are also examples of networks that are fast – and remain fast – even when the average data usage is high and during peak hours.

So next time you see an operator boasting about a speed trophy, remember to correlate it with its data usage. If usage is high, that operator in indeed something. If usage is low, future will show whether its network can deliver also under pressure.