
There are several ways to measure network performance and the results of published tests can therefore differ.
Mobile operators have a tendency to criticise test results when they have lost and promote results when they have won.
 An example of this is the recent drivetest by Connect Magazine in Switzerland as performed by P3 Group. Whereas Salt seems furious – the CEO-commented release is an interesting read – Sunrise uses the results in its marketing.
Who will be the first operator – anywhere – to complain about a test methodology after having won?
What differs even more than the network test results is the perception of network quality. For an operator it is much more important that its customers are having the perception of the best network than actually having the best network.
But the best way to influence that perception is – in the long run – to also have the best network.
To understand why network quality is such a sensitive topic for mobile operators, read this blog from May 2016.
Whereas drivetests seldom can represent actual customer behaviour, crowdsourced data – especially when collected in the background – has the potential to.
Will crowdsourced data then prove which operator that, technically speaking, has the best network? Not necessarily, because different operators are not having the same type of customers. If the perception is that an operator has much better coverage in a certain part of the country, it’s likely that this operator over time will get more customers there and proportionally more of the crowdsourced data will thus originate from this area. Even within the same geographical area, usage patterns can be different. A certain operator could be more popular among young data-heavy adults living in apartment blocks in cities whereas another operator is popular among parents typically living in suburban houses. The beauty of crowdsourcing done right is that it takes customers’ everyday habits into account. Or at least the habits of their smartphones; there is a theoretical chance that some customers do leave it behind at times.
So when we now dive into OpenSignal‘s crowdsourced stats from the Nordics let’s remember that the stats can give the answer to “Who has the best network – for its customers?”.
The data is gathered from September to November 2017 and covers about 270 million readings from about 12000 unique devices. The data has not been published by OpenSignal but has been shared with us through OpenSignal’s analyst program.
4G availability
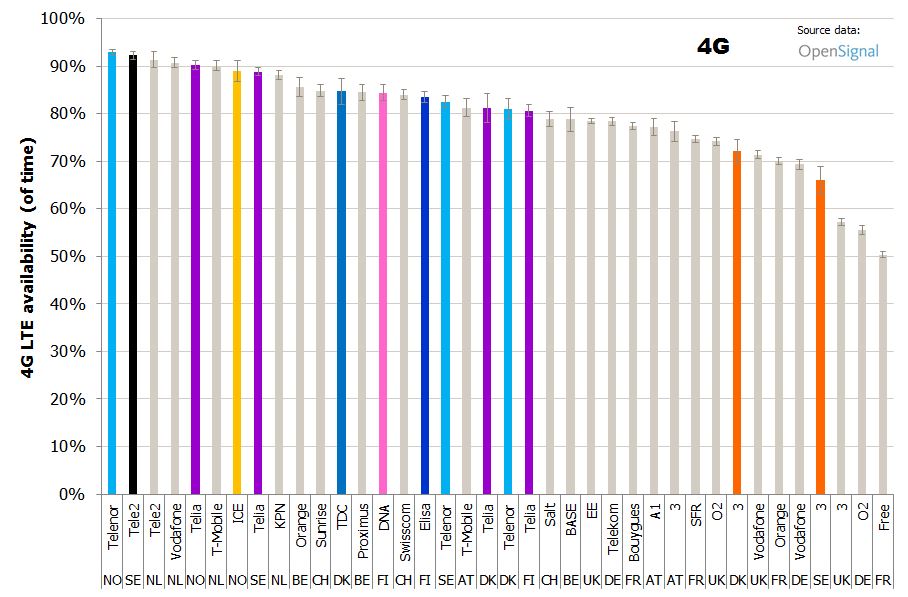
The graph below ranks the fourteen operators in Norway, Sweden, Denmark and Finland after how large proportion of time 4G LTE capable devices have been connected to 4G LTE. OpenSignal calls this 4G availability.
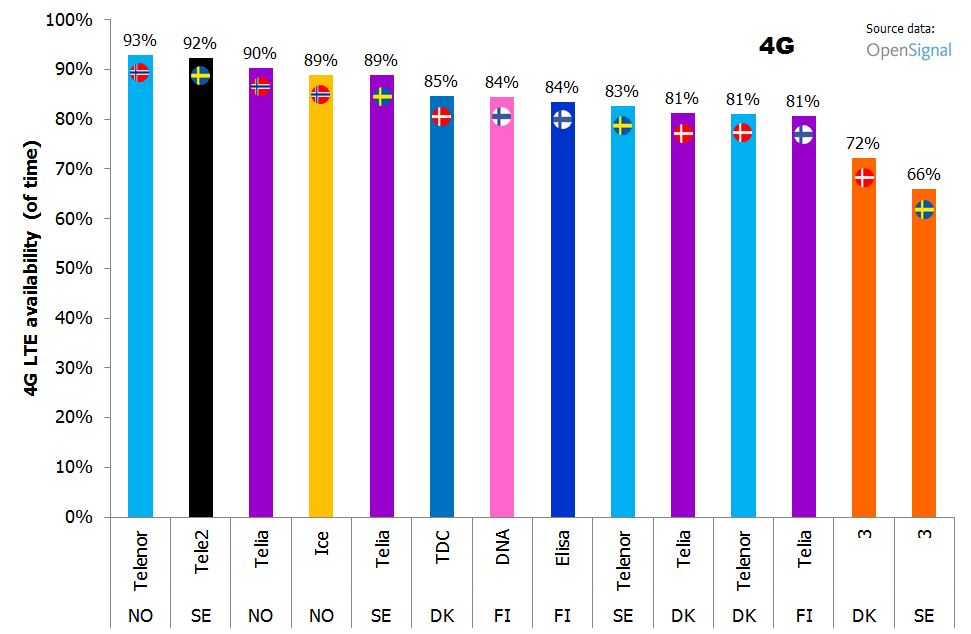
 Telenor Norway is providing its customers with 4G 93% of time (confidence level 92,2-93,5%) – thereby winning this category. This is lower than the 99% population coverage that Telenor communicated this month – but higher than the 75% area coverage that Telenor communicated at the same time. The first difference can be explained by customers being indoors (population coverage is normally defined outdoors), the second difference by population concentration. About 30% of Norway’s population lives in the capital area.
 Also the customers of Telia and Ice Norway are most of their time on 4G: 90% and 89%. It’s important to point out that Ice’s 4G network (for smartphones) still is small – 24% of the traffic was carried by Ice’s own network in the third quarter of 2017. The remaining 76% of traffic was on Telia’s network. Without the national roaming agreement with Telia, Ice’s 4G availability would obviously be much lower.
 In Sweden, Tele2‘s customers are having the best 4G availability: 92%. Since Tele2 is sharing the 4G network with Telenor, it’s at first surprising to see that Telenor’s 4G availability is lower, 83%. Shouldn’t it be the same? Not necessarily; Telenor’s customers might have another geographical distribution and/or usage patterns than Tele2’s. Another explanation is that Telenor – that is using another 3G network – uses different criteria for network selection resulting in a higher probability of being on 3G.
New stats from PTS, the Swedish regulator, also show a significantly lower share of mobile data traffic carried over 4G in Telenor (65%) and 3’s (58%) cases compared to Tele2 (90%) and Telia (88%).
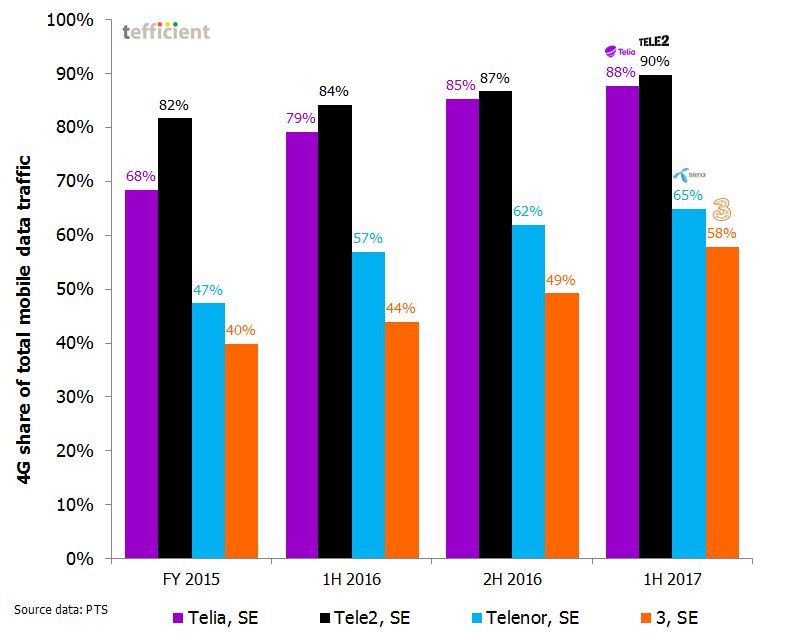
In this context, we need to point out that Telenor and 3 are sharing the same 3G network (3GIS) in most of Sweden – whereas Tele2 and Telia share another 3G network (Svenska UMTS-nät). The difference in 4G availability between Tele2 and Telenor could then perhaps also be attributed to the 3G network.
If we revert back to the 4G availability chart, 3 Sweden has the lowest value among the Nordics operators, 66%. 3 communicates a higher population coverage figure, 86%, but it’s much lower than Tele2/Telenor’s 99,9% and even lower than their communicated 90% area coverage. 3 has a much smaller 4G network than Tele2/Telenor and Telia and therefore it’s logical that 3’s share of traffic on 4G is low (58%).
 In Denmark, TDC has the highest 4G availability (85%). Also here, 3 is having the lowest availability (72%) whereas Telenor and Telia, both with 81%, are closer to TDC. The fact that Telenor and Telia have the same value is interesting since they share the same network (TT-Netværket). So why don’t we see a similar difference as in Sweden? One explanation is that Telenor and Telia’s network is shared on all technologies – 2G, 3G and 4G. In contrast to Sweden, the 3G network is thus the same and Telenor and Telia are likely using the same criteria for network selection.
 In Finland, it’s DNA that has the highest 4G availability, marginally ahead of Elisa with the same (rounded) 84%. Telia is somewhat behind with 81%. Also in Finland there’s network sharing: Telia owns 51% and DNA 49% of Ytheisverkko. As in Denmark, the network sharing covers all technologies, but unlike elsewhere the Finnish JV is just covering the north and east parts of Finland – roughly half of Finland’s area, but the home of just 15% of the population. We should therefore not expect identical figures for DNA and Telia.
Who has the network with the highest 4G availability in the Nordics? Telenor Norway.
This is the case even though Tele2/Telenor Sweden has higher population coverage (99,9% vs. 99%) and higher area coverage (90% vs. 75%). The most plausible explanation is that the population and usage in Norway is more concentrated than in Sweden.
Overall (3G/4G) speed
Our next graph ranks the fourteen operators after average download speed – regardless of if 3G or 4G has been used.
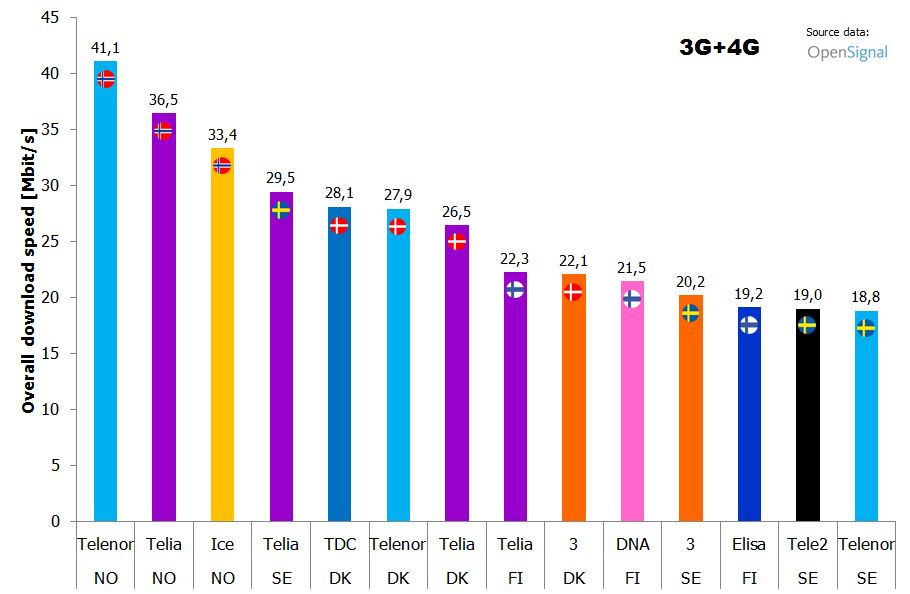
The three Norwegian operators Telenor, Telia and Ice are leading the speed race in the Nordics. As shown in the previous section, Telenor Norway also had the highest 4G availability, but it is actually so that Telenor is also having the fastest 3G speeds of the Nordic operators (see below) so the explanation is not just to be found in a high 4G availability.
A stark contrast to Telenor Norway is the positions of Tele2 and Telenor Sweden: Even though these operators have the best covering 4G network in the Nordics (with 90% area coverage), the average speed is the slowest. Speed is obviously not just about 4G coverage. The degree of LTE-A (4G+) deployment will have an impact – but so will load. Norway has a significantly lower data usage than Sweden, Denmark and, most definitely, Finland. Our upcoming data usage analysis (here in the end of December) will show that of the Nordic operators, Telenor Norway has the lowest usage.
To get a feel for the correlation between speed and load, read this blog from September 2017.
We are not suggesting that the position of the Norwegian operators will drastically deteriorate if the usage levels in Norway will approach those in rest of Nordics, but the Norwegian engineers are currently having a bit easier job to deliver speed than its Nordic colleagues.
Are then the Finnish networks slow because of network load? Nobody knows. It’s important to point out that crowdsourced data is based on the actual experience of the smartphone user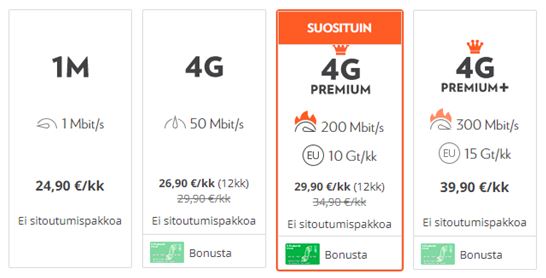 . The Finnish operators are seldom charging for data usage; on most plans the buckets are unlimited. But the operators are monetising based on speed tiers – see the example from Elisa. In June 2017, it was just 57% of the Finnish non-M2M SIMs that have bothered to buy subscriptions with a speed tier of 30 Mbit/s or higher. This means that there are many Finns walking around being throttled all the time to save some money. This is of course affecting the crowdsourced speed data negatively. Until a year ago, Norwegian operators were too having speed tiers (but not unlimited data) and in the Norwegian case the removal of these tiers had an obvious effect on speed – see the lift in the Norwegian download speed shown below based on another crowdsourced test (by Ookla Speedtest) when Telenor and Telia Norway removed the speed tiers in September 2016.
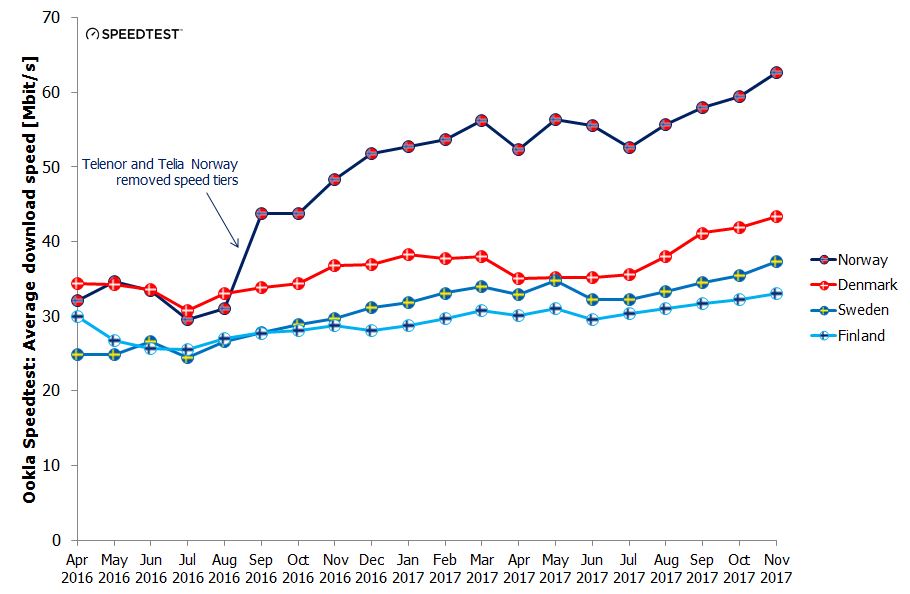
Ookla uses another methodology than OpenSignal: Ookla measures peak speed by connecting to the operator core network whereas OpenSignal runs tests on CDNs and mirrors what users themselves do. The numbers shouldn’t therefore be compared – but the trend before and after the removal of speed tiers is nevertheless interesting. Wonder where Finland would be without the speed tiers?
Who has the network with the highest overall download speed in the Nordics? Telenor Norway.
3G speed
We just concluded on the overall download speed, but we thought the 3G-only speed provides an interesting comparison. After all, there are many customers out there with terminals that aren’t capable of 4G – and, as seen, 4G networks aren’t available 100% of the time – making 3G networks important or even critical for the overall experience and speed (not to speak about voice where 3G massively dominates 4G’s VoLTE – only 0,3% of the Swedish mobile voice volume was VoLTE in the first half of 2017).
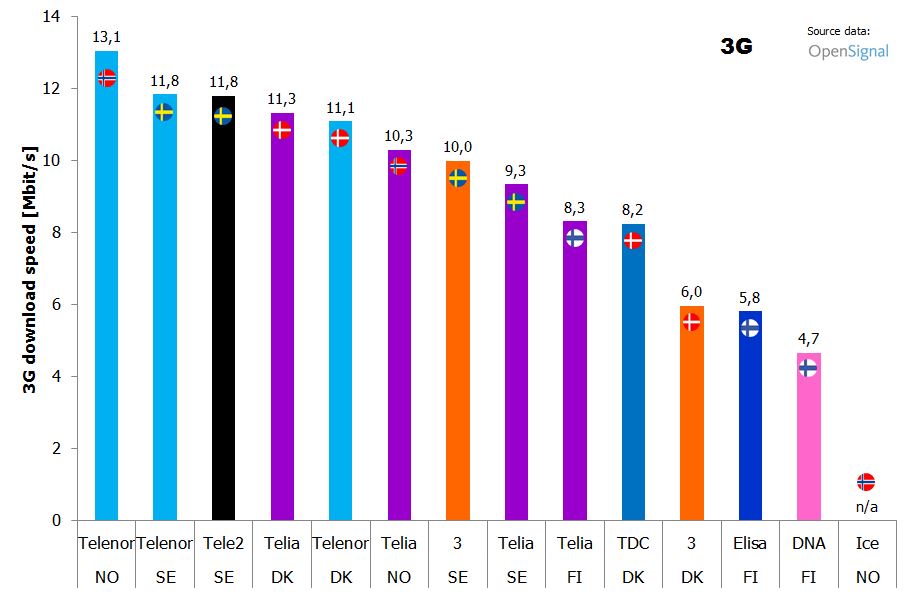
When it comes to speed, the Finnish 3G networks are delivering much slower experiences than the fastest 3G networks in the Nordics. This can be because of speed tiers but also because of high load triggered by unlimited data volume also on 3G. It’s interesting to note that the 3G speed order is inverse compared to the data usage order; DNA has the highest data usage, Elisa is in the middle and Telia has the lowest usage.
As said already, Telenor Norway wins the speed comparison also in 3G (confidence level 11,3 to 14,8 Mbit/s). Telenor and Tele2 Sweden follows – both on 11,8 Mbit/s – even though they use different 3G networks. Telia and Telenor Denmark – who do share the same 3G network – deliver similar speeds.
Who has the 3G network with the highest download speed in the Nordics? Telenor Norway.
While the engineers and management of Telenor Norway now run out to celebrate, we would just like to remind everyone that whereas Telenor Norway provides the best mobile experience in the Nordics for its customers, it doesn’t mean that they have the best network. One thing is clear, though: We have access to extraordinary good mobile networks in the Nordics.
To exemplify, let’s highlight the 4G availability of the 14 Nordic operators in a sample that also includes the Netherlands, Belgium, Switzerland, Austria, UK, Germany and France.
To get a global view of 4G LTE, dive into OpenSignal’s latest State of LTE report.