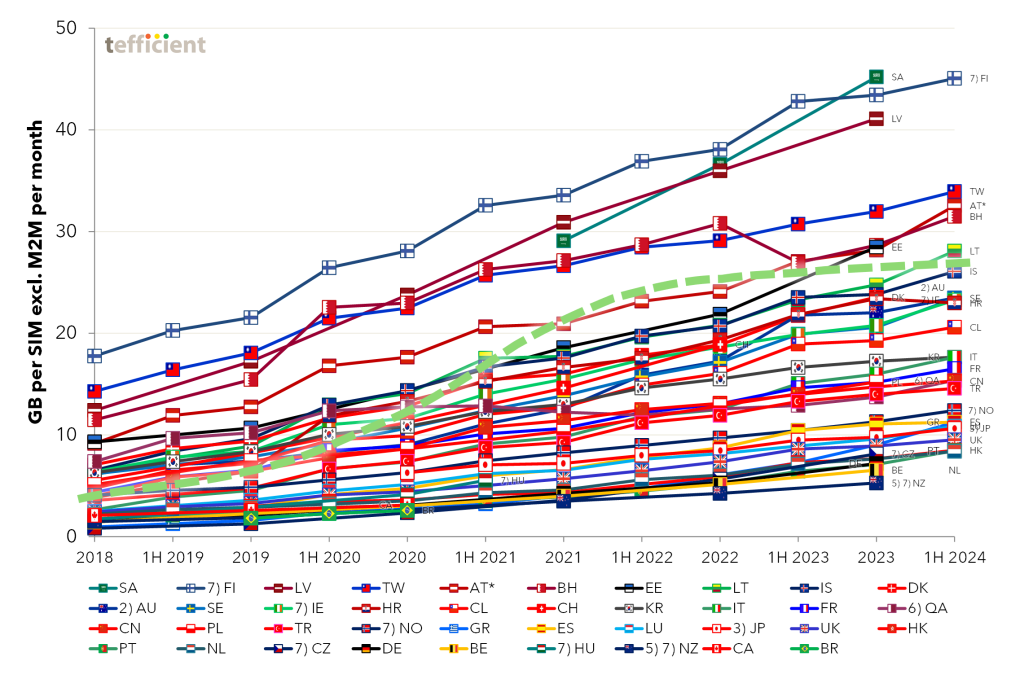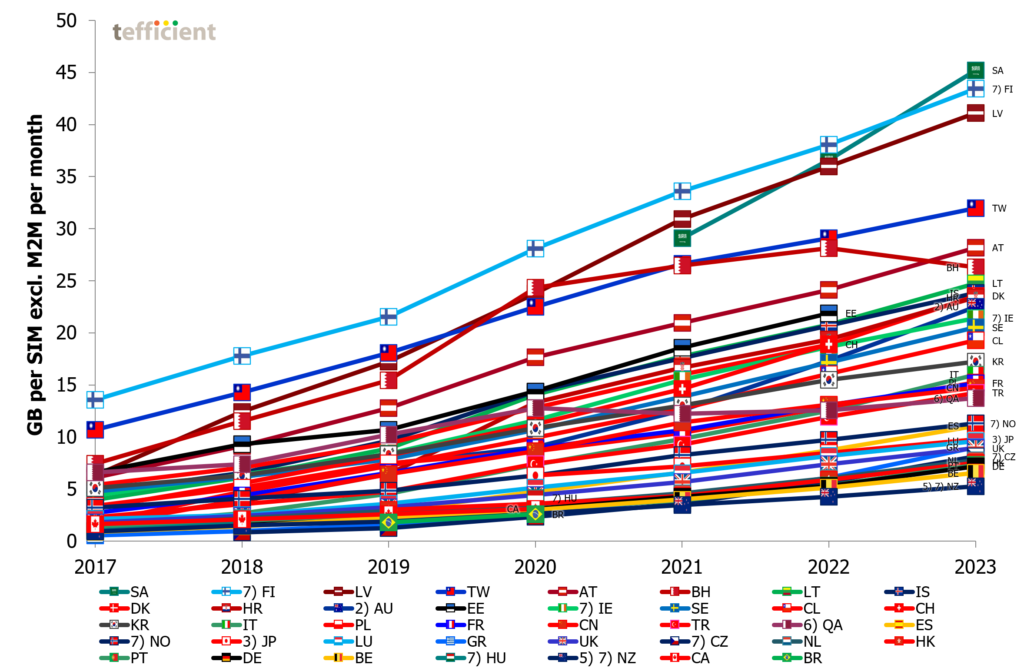
Tefficient’s 47th public analysis of mobile data trends and drivers compares data from 40 countries where M2M/IoT can be excluded from the total bases. Mobile data usage grew year-on-year in all markets, but Hong Kong’s usage was flat.
Latvia new leader
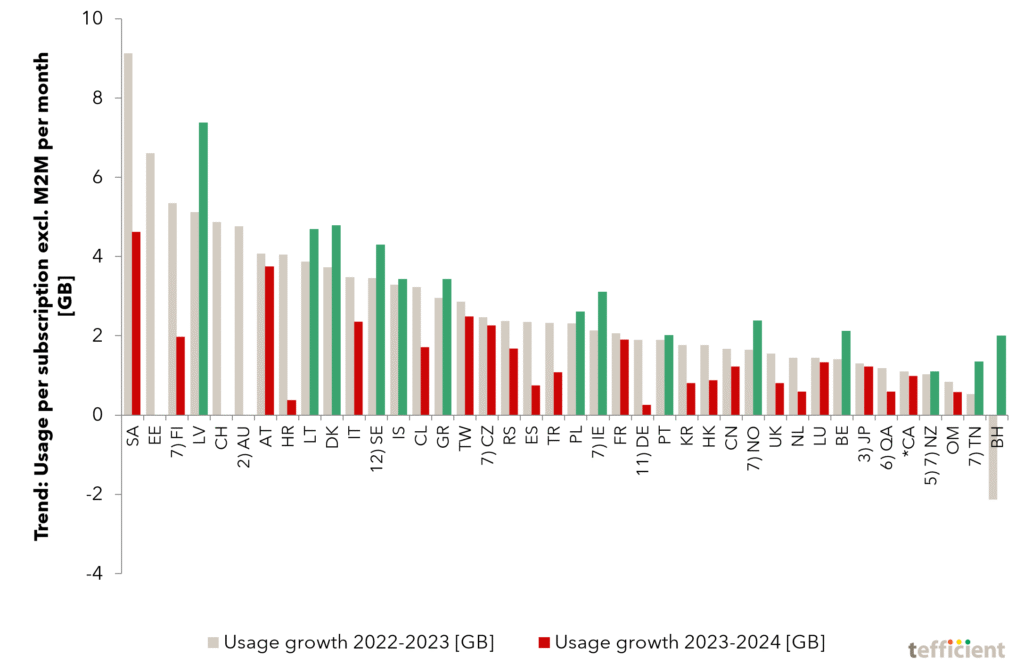
In the absence of 2025 data from Saudi Arabia, Latvia emerges as the usage leader.
Growth rates stabilised
After the sharp slowdown between 2023 and 2024, usage growth rates have largely stabilised. A narrow majority of the markets recorded faster growth in 2025 than in 2024. Among the countries analysed, Portugal posted the highest annual increase at 37%. No market experienced a decline in usage, although growth in Hong Kong was close to zero.
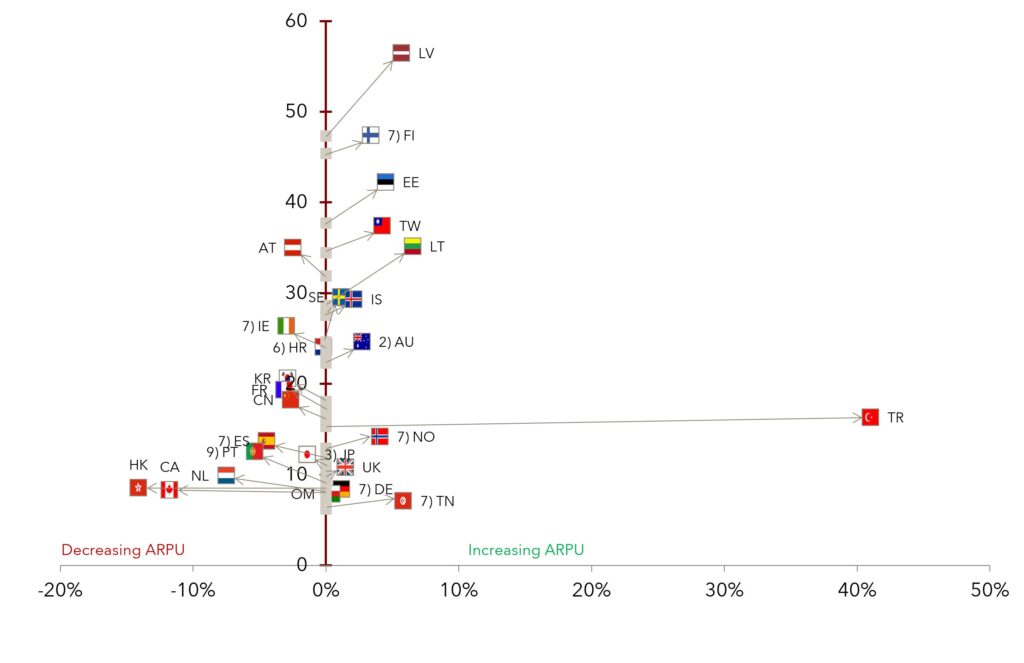
Continue reading More data used – only half of markets grew ARPU