
The Finnish-Estonian operator Elisa just published its 4Q 2017 results. And it was a new record in revenue and profitability.

How is that even possible? Readers of our public analysis of mobile data usage know that Finland is the mobile data usage powerhouse of the world – and that Elisa is no exception.
But Elisa doesn’t charge per gigabyte – so where is the revenue growth coming from? How can the company make more profit when it needs to handle all that traffic? This blog reveals their secret.
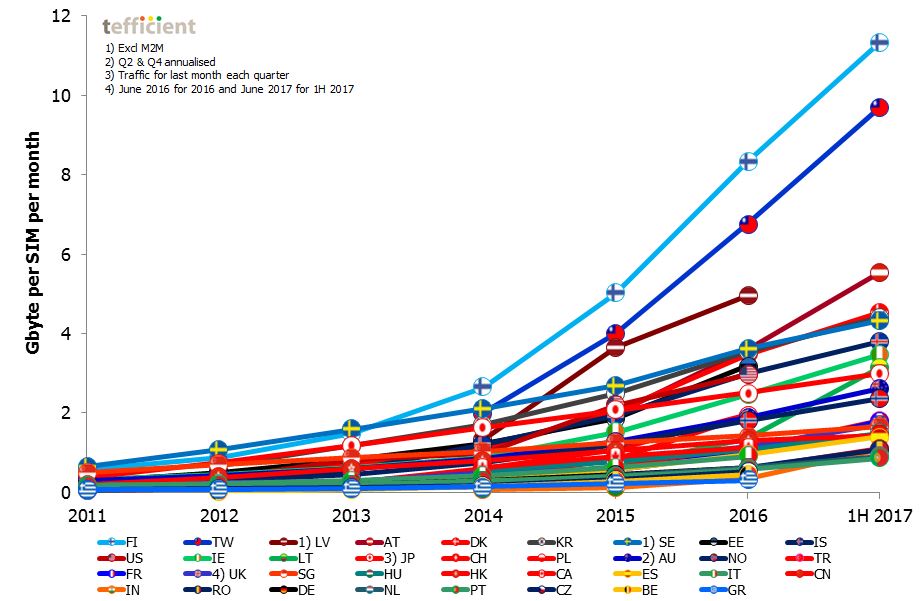
Finland won the global No 1 data usage position in 2014 and it appears as if the country has no intention to lose it. To understand why this happened, we need to go back in time. To when the smartphone was new and streaming wasn’t yet heard of – to 2007.
This was the year that Elisa launched its first unlimited mobile data plan. It was the first of its kind in Finland. But when other operators a few years later started to fear traffic growth and hence launched tiered bucket plans, Elisa held to it and developed it further. The company made it a standard offer for all consumer customers when it launched the world’s first speed-tiered unlimited data proposition in 2011.
A brave decision
Elisa’s management has expressed the view that a megabyte unit is incomprehensible for users and that data caps simply aren’t customer friendly. It seems as if they might be right; Elisa turned many of its customers into fans and Elisa’s “missionaries” have in a long series of ads travelled the world to proclaim the religion of unlimited data:
In the fourth quarter of 2017, the average Elisa mobile subscription consumed 14.8 GB per month. Even though Finland is just having 5.5 million inhabitants, Elisa’s network is the fifth largest in Europe when it comes to mobile data traffic.
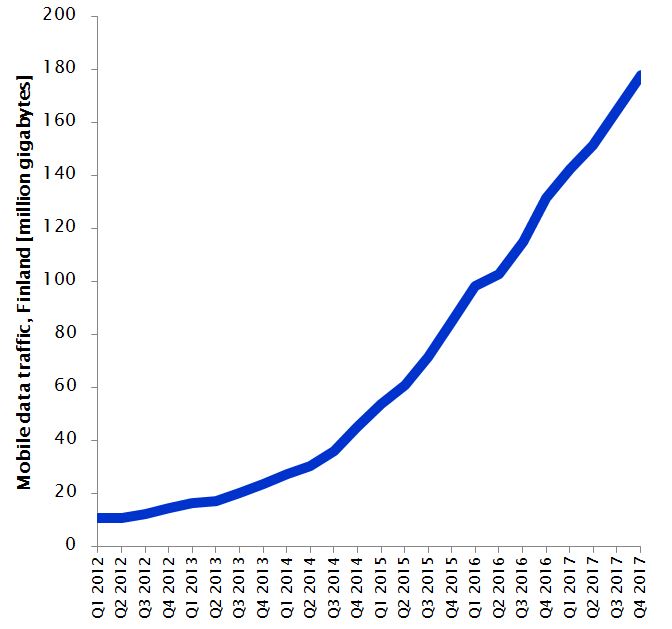
The graph below shows how Elisa’s mobile data traffic has developed. It’s 16 times higher today than what it was six years ago.
But if the unlimited decision was brave, what followed was braver. With Finnish sisu, Elisa’s management also decided to cap its cost to revenue ratios. The implementation of these new targets led to a decoupling of costs from traffic but it didn’t happen ‘just like that’. It required a new set of tools in the efficiency toolbox. Automation started to play a key role in Elisa’s goal to improve its efficiency. At the same time, the speed-tiered unlimited proposition propelled Elisa’s revenue growth to a high level. Thanks to new innovations in automation, that growth has been profitable. And it still is. The proof is in the numbers.
Fast mobile service revenue growth
The graph below shows how Elisa’s mobile service revenue (excl. interconnect and visitor roaming) has developed year-on-year.
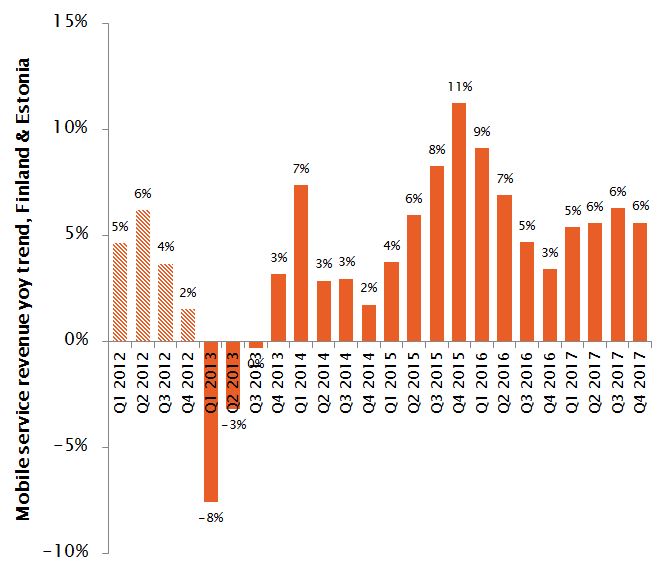
Note 1. As Elisa doesn’t break out Finland in its reporting of mobile service revenue, Estonia is included. Estonia represented 9% of Elisa’s total integrated (mobile and fixed) revenue in Q4 2017.
Note 2. Elisa’s reporting of mobile service revenue doesn’t go back longer than 2012. For 2011, the graph above therefore shows the development in total mobile revenue.
In a typical quarter since the beginning of 2014, Elisa’s mobile service revenue has grown with about 5%. This has happened mainly through growth in ARPU as, in a typical quarter, the mobile subscription base grew with about 1%. It is challenging to find another mature market operator with a similar track record in mobile service revenue growth as Elisa.
Low, stable, OPEX
Revenue growth is great, but the other side of the coin is often that it comes with a yet faster expansion in OPEX. In contrast, Elisa’s revenue growth has been profitable. The graph below shows Elisa Finland’s integrated OPEX in MEUR – the blue line. It has grown a bit, but if we relate it to the revenue, we get the orange bars – the OPEX to revenue ratio.
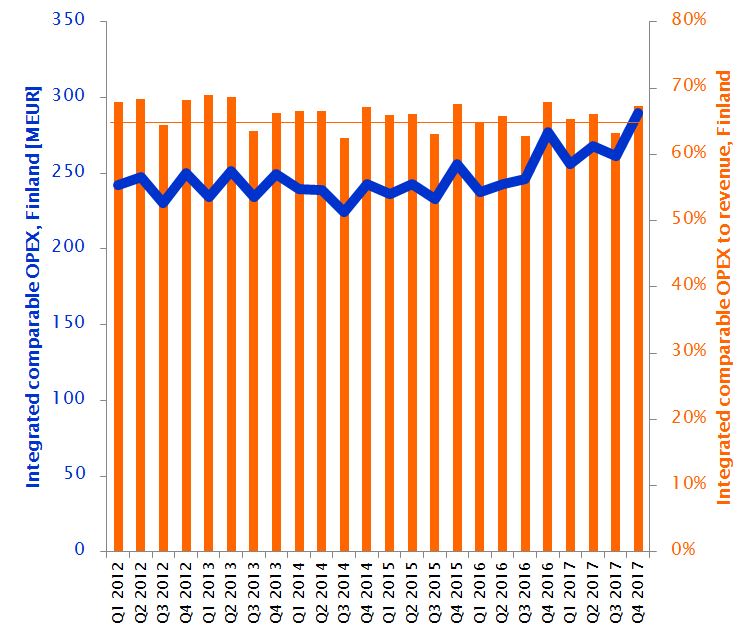
The bars show how Elisa quarter after quarter, year after year, has delivered an OPEX to revenue ratio of around 65%. Remember that the mobile data traffic grew 16 times during these six years.
If we subtract OPEX from revenue we get EBITDA. The OPEX stability of Elisa means that its EBITDA margin has been kept stable at around 35% throughout these years. And that implies that the observed revenue growth is profitable: Elisa’s revenue has grown without any negative effect on the EBITDA margin.
Low, stable, CAPEX
Another ratio that hasn’t deteriorated is Elisa’s CAPEX to revenue.
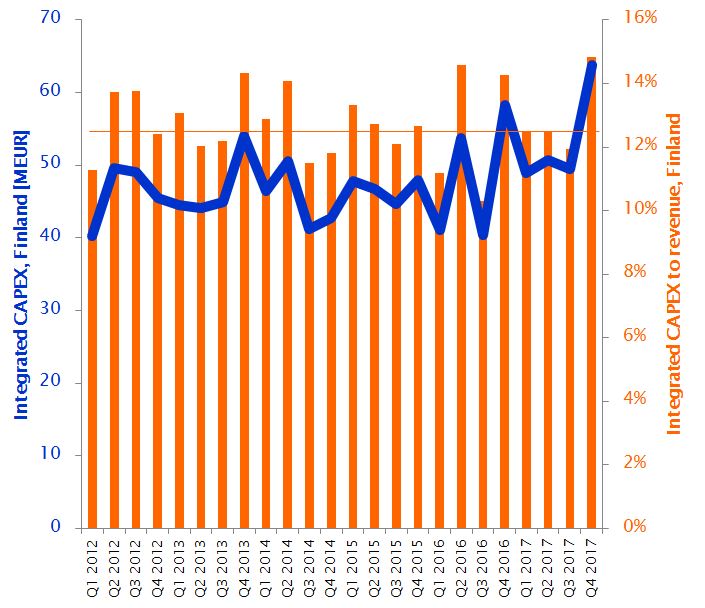
The graph above shows Elisa Finland’s integrated CAPEX in MEUR – the blue line. It has grown a bit, but if we relate it to the revenue, we get the orange bars – the CAPEX to revenue ratio.
With some seasonal variations, Elisa’s CAPEX has been around 12% of revenue during these six years. In the same time period Elisa’s mobile traffic increased with a factor of 16, but the CAPEX to revenue ratio didn’t increase.
Elisa decoupled its costs (both OPEX and CAPEX) from traffic and it is impressive given the traffic volume and the growth in that traffic volume.
So what is the secret?
The traffic development – combined with the ambitious targets – forced Elisa to seek new innovative solutions to improve efficiency. Automation of network tasks became a cornerstone in Elisa’s transformation. It started with a full automation of the network operations centre in 2010 (yes, they are only having robots in the NOC room!). Today, the company runs more than sixty automation use cases in its network operation and optimisation.
Elisa has now decided to make its automation solution for network optimisation – the Elisa SON – commercially available also to other operators. In this process, we helped Elisa formulate an inspiring proposition.
But why not go directly to the source?
Decouple costs from traffic. We’ve done it. Now it’s your turn.
![]() At elisaautomate.com you can take a look at the Elisa SON use cases, watch the interviews with Elisa’s management and leaders – and read about Elisa’s achievements in customer satisfaction, network quality, transformation and cost savings.
At elisaautomate.com you can take a look at the Elisa SON use cases, watch the interviews with Elisa’s management and leaders – and read about Elisa’s achievements in customer satisfaction, network quality, transformation and cost savings.