In four of the largest European markets – Germany, France, UK and Spain – we see three out of four mobile operators reporting their 4G LTE rollout status. Most of them also report (or indicate) their 4G LTE customer base.
After much hesitation, the 4G LTE rollout eventually started also in Europe. And you know what? Customers are coming. If they are covered, that is.
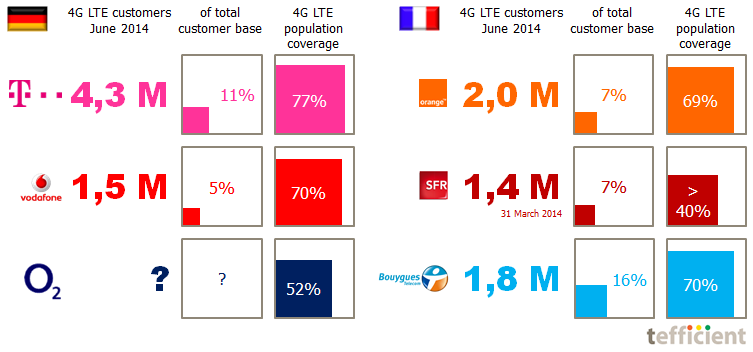
The country pictures show the overall market leader at the top. Telekom has the largest 4G LTE network in Germany and had 11% of its customer base on 4G LTE by the end of June.
In France, Bouygues Telecom shows how a small No 3 operator through aggressive focus on 4G LTE rollout can challenge the 2.5x larger Orange on the total 4G LTE customer base. 16% adoption is among the highest in Europe.
SFR – in the process of being acquired by Numericable – didn’t report their 4G LTE figures in Q2. Arcep, the French telecom regulator, however critisised SFR in June for their 4G LTE coverage claims, saying their population coverage was just 30%. [Bouygues and Orange claims were OK whereas also Free was critisised. Their population coverage was said to be 24%].
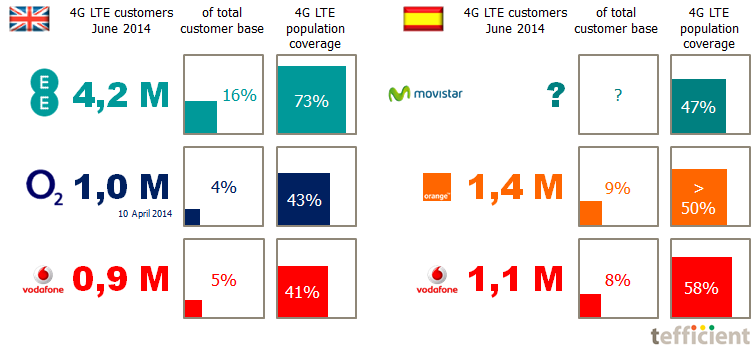
UK is behind on 4G LTE rollout, partly because of late licensing. Market leader EE was given a head start when it was allowed to refarm 1800 MHz spectrum and use it for 4G LTE.
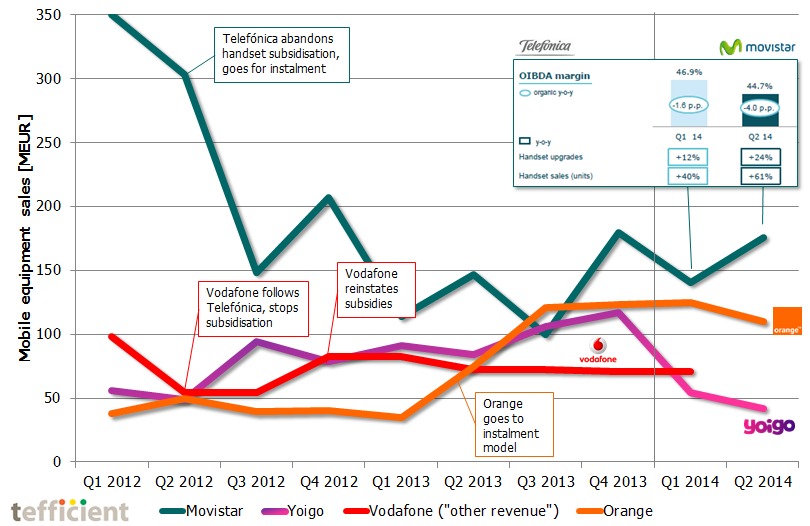
In Spain, market leader Movistar is behind Vodafone and Orange on 4G LTE rollout. Telefónica doesn’t report the number of 4G LTE customers in Movistar which might be an indication of that it’s low.
Neither E-plus, Free, ‘3’ nor Yoigo report figures on 4G LTE. We see this an indication of them being behind on rollout and adoption. E-plus is now in the process of merging with O2.

 Preparing and presenting “How are telcos, cellcos and cablecos using Wi-Fi to strengthen existing business?” for 200 participants at the Wi-Fi Innovation Summit in Copenhagen 9-10 December.
 .
. Wi-Fi has become a tool in the operator toolbox. In this analysis – our third on the subject – we show how telcos, cellcos and cablecos use Wi-Fi to strengthen existing business. It’s a mixture of hotspots, homespots and new business models.
 Analysis & Go-to-market, 2014