
Orange Switzerland (which since 2012 isn’t owned by Orange Group) is just about to be sold to Xavier Niel’s private holding company. What makes it interesting is that Niel is the person behind Iliad, the company who operates under the Free brand in France. Continue reading Niel buys Orange Switzerland: So will Swiss headcount follow French?
Category Archives: Analysis
Four years (and a net neutrality law) later, Dutch operators foul again
Dutch operators KPN and Vodafone were both fined for violations of net neutrality today.
KPN got a fine of 250000 EUR for having blocked access to voice over IP services on public Wi-Fi hotspots. Vodafone was fined 200000 EUR for having zero-rated content from HBO. Continue reading Four years (and a net neutrality law) later, Dutch operators foul again
Rollover: The next big thing for customer retention
 Bucket plans – with volume caps on the number of minutes, messages and Mbytes – have been offered by mobile operators for years. Even though the composition has varied over time (e.g. through elements made unlimited), the concept is well known to customers.
Monthly caps have become the standard of our industry. Another standard is to reset those caps at the start of a new month. This means that any balance left – minutes, messages, Mbytes – is voided. Or confiscated – to use the word of John Legere, CEO of T-Mobile USA. Continue reading Rollover: The next big thing for customer retention
The Alps operator benchmark
In 2013, tefficient introduced the Nordic operator benchmark to telcos in Sweden, Finland and Norway. The feedback has been strong, leading to repetitions in 2014 and 2015. Denmark was added in 2015.
Unlike other benchmarks, it has a local view since the peer group only contains operators from the covered countries – which have been selected based on high comparability. Unlike other benchmarks, it is therefore 100% fact based since no numbers need to be “adjusted” in an attempt to mask that they weren’t comparable in the first place. Continue reading The Alps operator benchmark
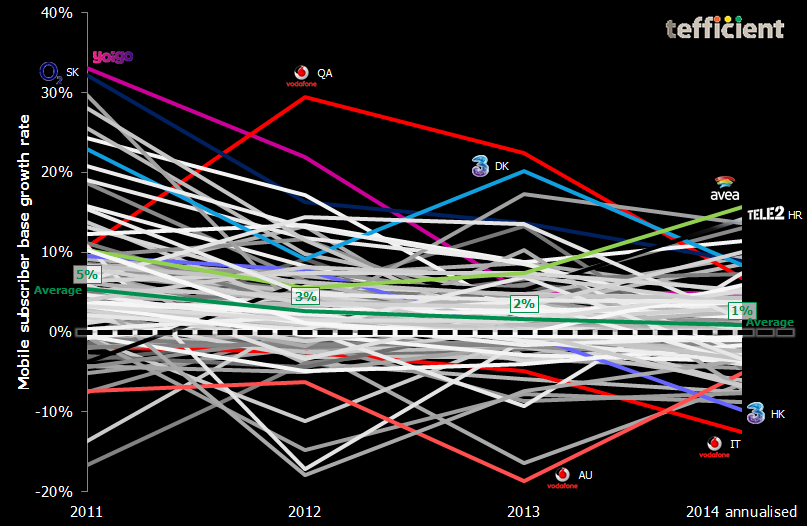
Zero-SIM game
The graph below shows the annual (2014: annualised) growth rate in reported mobile SIM base for about 100 mobile operators in mature markets globally.
Copper Europe?
Whereas the “Europe is behind” accusation today is a myth rather than a fact when it comes to 4G LTE rollout, Europe still has an issue when it comes to really fast, two-way, fixed broadband – something only fiber-to-the-home (FTTH) or fiber-to-the-building (FTTB) networks can deliver. Continue reading Copper Europe?
Churn: Still a concern
The subsidy model – which dominated operators’ handset and equipment sales in mature markets for decades – is rightfully retiring. It wasn’t a brilliant idea to discount goods not produced inhouse (taking cost pressure away from equipment manufacturers like Apple) and, to compensate, overcharge for the services actually produced (making over-the-top services and Wi-Fi more attractive). Continue reading Churn: Still a concern
4G LTE coverage: Europe catching up, led by less populated countries
For a long time, lobbyists used the 4G LTE rollout and -adoption discrepancy between US and Korea/Japan (on one hand) and Europe (on the other hand) as a “proof” of too rigid European telecom regulation.
The basic fact that major US, Korean and Japanese operators are running CDMA2000 without the European possibility to gracefully migrate to 4G LTE was tactically neglected in this comparison. Continue reading 4G LTE coverage: Europe catching up, led by less populated countries
“Peak data” in sight
 This is tefficient’s 10th public analysis on the development of mobile data usage. For the first time, we see clear signs of saturation.
Operators’ squeeze-out of unlimited customers continues. The growth in smartphone penetration has levelled out in high usage markets. 4G is becoming mainstream. Public Wi-Fi starts to disrupt.
Are we approaching “peak data”?
Download analysis: tefficient industry analysis 7 2014 mobile data usage peak ver 2
New operator Wi-Fi analysis: Straight to the top
Our new public analysis of How operators use Wi-Fi to strengthen existing business went right into the No 1 position of most downloaded in 2014 – even though it was made available as late as 8 December.
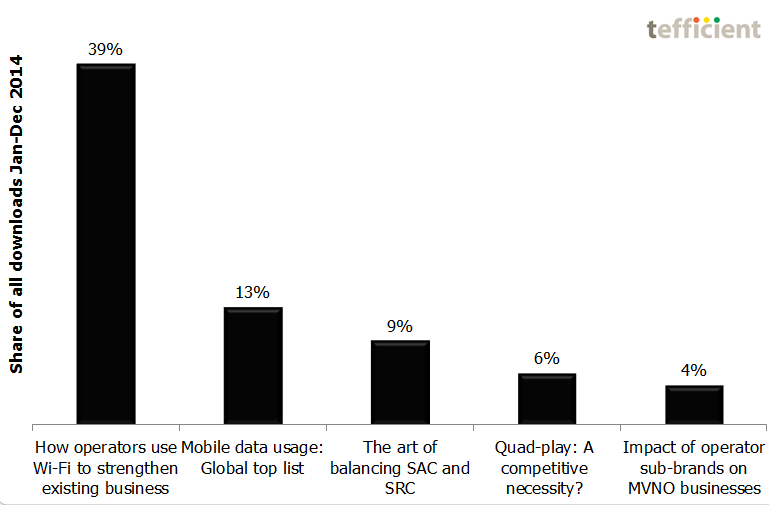
The presentation at the Wi-Fi Innovation Summit seems to have created a lot of interest: The analysis was downloaded 800 times in the two weeks thereafter.
You’ll find the other top 5 analyses – and a few more – at the Analysis page.