Network sharing JV benchmark 2013

Network sharing benchmarkComprehensive business benchmark including a total of 129 KPIs covering revenue, OPEX, CAPEX, productivity, traffic load and network quality – with a peer group solely consisting of network sharing joint ventures.

Due to pre-agreed confidentiality requirements, the identities of participating JVs are fully anonymous.

The results demonstrate the value of the JV-specfic benchmark approach: Network sharing JVs have established cost and productivity levels that are elevated far beyond the obvious sharing effects. Also network quality levels are very high even though traffic load is higher. To improve further, JVs need to compare with their likes – other JVs – and not to regular mobile operators.

Monetising big data: Operator best practice

Analysis, 2013

Who are the operators with the most advanced vision for monetisation of big data? How have they positioned themselves and their products? Which ecosystem are they targeting? What are the actual opt-in and opt-out figures? How is the privacy issue dealt with? How much revenue is created so far?

These questions were answered in an analysis provided to a global provider of business support systems.

Quad-play: A competitive necessity?

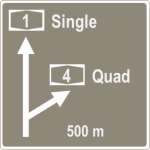
quad signTriggered by Vodafone’s 7,7 BEUR cash offer for cableco Kabel Deutschland and the emphasis Vodafone has put on communicating the importance of being able to offer quad-play (fixed broadband, TV, voice and mobile) in the German market, the question has to be asked: Isquad-play a competitive necessity?

This analysis compares data from operators that have taken the quad-play road: Orange France, SFR, Movistar Spain, Virgin Media, Swisscom, TDC and Orange Poland.

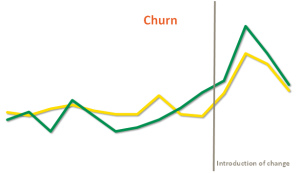
Their take-up might be impressive – driven by significant discounts – but what effect has it had on customer loyalty?

Download analysis: tefficient public industry analysis 9 2013 Multi-play

Sweden-Finland-Norway-specific mobile operator benchmark 2013

Sweden Finland NorwayBenchmarks, 2013

Peer group consisting exclusively of primary data from Swedish, Finnish and Norwegian operators. Due to pre-agreed confidentiality requirements, the identities of the participating operators are fully anonymous.Comprehensive business benchmark including a total of 444 KPIs covering revenue, OPEX, CAPEX, productivity, customer distribution, performance, load, quality and innovation & growth – for 33 functions within a mobile operator.

The results demonstrate the value of a region-specific benchmark approach: Swedish, Finnish and Norwegian operators have global leadership in a wide array of business aspects and a global benchmark would therefore leave them without guidance on how to improve further. In contrast, the participating operators have got a great tool to improve their local competitiveness even further.

Why operators should refrain from handset sales

Teeter signThe first mobile operators have already reached the tipping point where handset revenue exceeds service revenue. The only reason why the average handset revenue isn’t higher than 14% of total revenue is subsidisation: Handset cost averagely stands for 30% of operator OPEX.

The increase in handset sales is bad news for the EBITDA margin of operators. Even with a positive gross margin on handset sales, total EBITDA margin is diluted. The issue is deeper than handset subsidisation: Even when at its best, handset retail is a low margin business. Should operators opt-out?

Download analysis: tefficient public efficiency analysis 3 2013 Handset sales

Guest speaker at Comptel’s MWC stand 2013

Analysis and Consulting, 2013

Comptel MWC presentationAnalysis of operator business upsides and downsides when launching 4G LTE. Commissioned by Comptel. Live presentation of an extract of the analysis, titled “Pinpoint the right customers: LTE handsets in wrong hands will dilute margin” to Comptel’s customers at two occasions during MWC in Barcelona.

A special analysis, commissioned by Comptel was launched shortly after.

See this 1 minute video summary interview:

http://youtu.be/yK_5ExLSIIk

Comptel’s original blog: comptelblog.com/2013/02/is-there-an-monetization-upside-using-analytics-when-launching-lte/

Monetising data traffic: International implementations and outcome

Analysis, 2012

Market analysis covering differentiation parameters in commercial offers (throughput, allowance, service content, QoS, price), overage handling and traffic management policy for 17 operators in 5 key markets globally. Concluding what worked – and what didn’t. Resulting in comparative recommendations. Commissioned by an international operator group.

Play in a league of their own: Swedish, Finnish and Norwegian mobile operators get their own benchmark

Sweden Finland NorwayPress release

Mobile operator revenue is under pressure. Increased competition leads to decreased prices. Smartphones have transformed the business of operators: Data services are now more used than both voice and messaging. In parts of the world, these challenges are however coped with.

“Swedish, Finnish and Norwegian operators play in a league of their own”, says Fredrik Jungermann at tefficient. “Nowhere else you’ll find as high mobile data traffic, as many smartphones, as many dedicated mobile broadband subscriptions and as high network quality. In addition, the mobile operators in Sweden, Finland and Norway are among the most productive operators in the world.”

To improve further, the Swedish, Finnish and Norwegian mobile operators can’t continue with global benchmarking – it is simply not challenging enough. Consequently, the international efficiency expert tefficient brings a benchmark specific to Sweden, Finland and Norway only.

The benchmark covers all business aspects: revenue, OPEX, investments, productivity, customer distribution, quality, load & complexity and innovation & growth. In total, there are 435 KPIs in the benchmark.

Swedish, Finnish and Norwegian mobile operators can – by using the benchmark and the analysis that comes with it – improve its local competitiveness.

Deadline for participation is 31 January 2013. Input data is for the full year 2012 and need to be finalized by 25 March. The results are ready latest 26 April 2013.

Measure, compare and improve competitiveness in telecoms