Category Archives: Analysis

The art of balancing SAC and SRC

salesmen 100x80This is our fourth analysis on subscriber acquisition cost (SAC) and subscriber retention cost (SRC). Previous SAC & SRC analyses showed that an increase in SRC had a positive effect on contract churn without any negative effect on EBITDA – as long as not exceeding 100% of contract SAC.

Our new analysis shows that much has happened in 2013: Average unit SAC and SRC have decreased significantly. How come – and what has it led to?

Based on data from 35 mobile operators in 24 mature markets globally.

The analysis comes in two versions: A public version which you can download below – and a premium version which adds country-specific SAC & SRC analyses on eight countries: France, Germany, Poland, Austria, the Netherlands, UK, Denmark and Canada.

Download public version: tefficient industry analysis 2 2014 SAC vs SRC – public version

Presentation on benchmarking and the Dutch mobile market

Analysis & Consulting, 2014

Allan NLPresented to the members of the Ambassadors of Telecom organisation in the Netherlands 13 March 2014. The title was “Benchmarking – and the tale of a wing clipped Dutch opportunity”. In addition to tefficient’s approach to benchmarking, we discussed if there is a mobile data dilemma in the Netherlands (comparing to the rest of the world).

The presented slides can be viewed here.

Shared plans: Providing fact-based recommendations

Analysis & Consulting, 2014

How have mobile operators introduced single- and multi-user shared plans in USA, Sweden, Finland, Norway, Denmark, Canada and the UK? Which business results have operators achieved and how has competition reacted? Which modifications have been necessary and when? Can the same customer loyalty effects be achieved without the heavy implementation of multi-user shared plans? Which defensive actions have proven to be most successful?

Based on these international facts and best practice, what would tefficient recommend? Taking local conditions, operator strategy and market position into account.

Commissioned twice by two different operators.

A1: “Historic low” churn comes at a cost (SRC)

A1, the Austrian incumbent, today reports a year-on-year EBITDA decrease of 19.4% for 2013. In this situation, you have to highlight the positives. Telekom Austria group is e.g. saying: “A1 Premium Monthly Churn Rate at Historic Low“.

By now, our industry should have learned that churn figures never can be referred to without also referring to the subscriber retention cost (SRC). It’s simple to decrease postpaid churn – if you have deep pockets: Pay higher SRC to get more customers to stay.

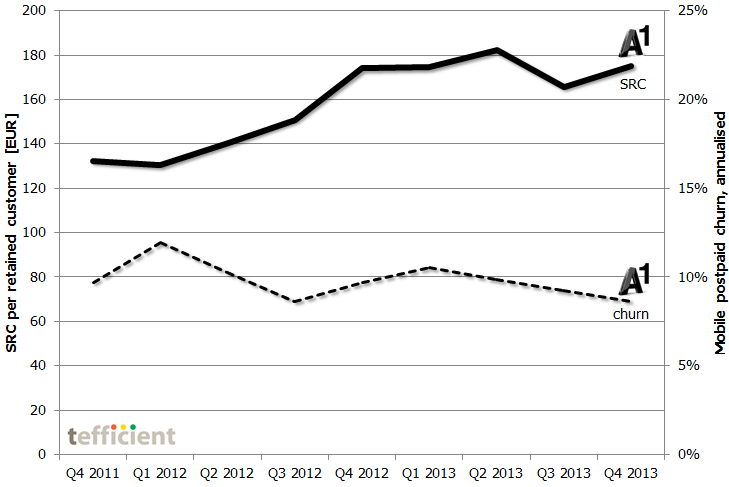
So since Telekom Austria hasn’t done it – let us plot postpaid churn against SRC. It’s the graph below.

A1 churn SRC dev 2011-2013

In 2013, A1 has been able to reduce postpaid churn to below 10% on annual basis which – internationally compared – is very low. But starting Q4 2012, A1’s SRC elevated from around 140 EUR to about 170 EUR. This happened at the same time as smartphone price points started to come down which, in other markets, was positive for SRC. The reason to A1’s increase must therefore be found in the local market: In January 2013, ‘3’ incorporated Orange to become a strong number 3 in Austria.

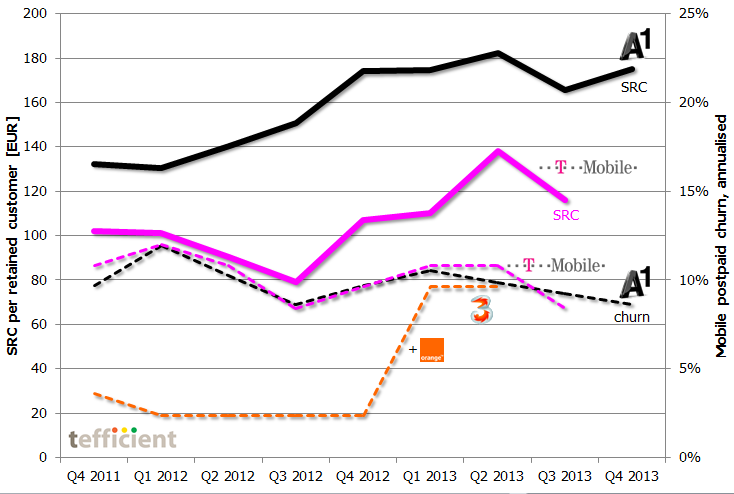
A1 churn SRC dev 2011-2013 with competitors

But how good is A1’s churn rate? If we plot the figures of T-Mobile and ‘3’ into the graph just above, we can see that competitors report as low churn as A1. (Prior to adding Orange, ‘3’ was even at annual churn levels below 3%). T-Mobile has followed A1’s SRC upwards, but from a lower level. In a local perspective, A1’s achievements seem in line or even substandard.

Note. T-Mobile and ‘3’ have not yet reported Q4/2H 2013. ‘3’ doesn’t report SRC.

Why more operators should care about alternative smartphone OSs

Alternative smartphone OSsOf global smartphone shipments Q3 2013, the four major operating systems stood for 99.4% – entirely dominated by Android. Why on earth should telecom operators then care to support the remaining 0.6%? Like Firefox, Tizen, Ubuntu and Sailfish?

Yet some operator groups, often with exposure to maturing markets, are actually doing a whole lot to breed viable alternatives to Android, iOS and Windows Phone. Why?

It’s not just about cost. In the established ecosystems, operators see the risk of being squeezed out. Partnering with providers of alternative smartphone OSs can re-establish operators in the ecosystem and give back control over the end-user experience.

Download analysis: tefficient public industry analysis 1 2014 alternative smartphone OSs

LTE doesn’t drive Korean smartphone penetration any longer

2013 ended with over 1 billion smartphones sold – a new record. But mature market operators should look at Korea as a projection of what will come: It is the world’s most advanced LTE market based on penetration and usage levels.
Korea smartphone LTE dev 2011 2013

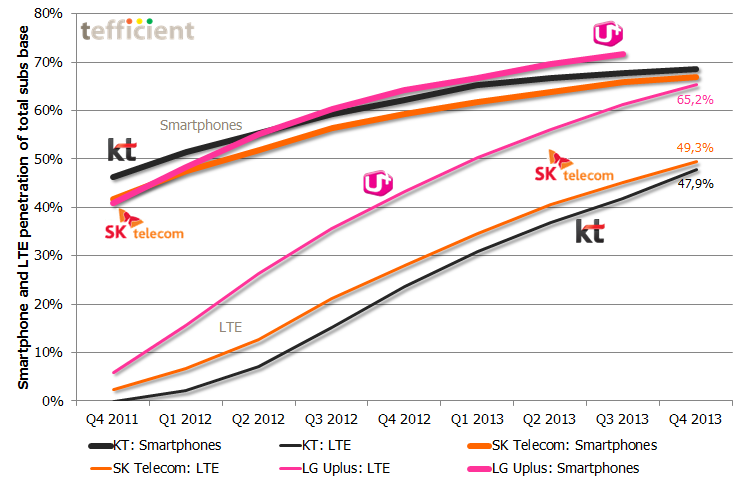
The operators in Korea – SK Telecom, KT and LG Uplus – are continuing to sell a lot of LTE equipment to its customers, even though sales slowed somewhat during 2013. But whereas the sales of LTE equipment earlier led to a lift in overall smartphone penetration, it looks as if it’s not going to drive smartphone penetration very much longer: See how the three top curves in the graph slow down even though the LTE curves go up.

Note: LG Uplus hasn’t yet stated overall smartphone penetration for Q4 2013. Non-LTE smartphones are soon phased out of LG Uplus.

In the world’s most advanced LTE market, LTE seems to run out of fuel. Existing smartphone customers do upgrade to LTE smartphones, but the overall smartphone penetration in Korea doesn’t climb above 70% [SK Telecom holds 50% of market, KT 30% and Uplus 20%]. If we extrapolate, the LTE penetration will equal the smartphone penetration during 2014 – more or less.

For mature market operators believing in LTE’s ability to take smartphone penetration levels beyond the 70% level observed today in countries like e.g. Sweden, Norway, the Netherlands, Australia, the UK and France this is bad news. The Korean development indicates that LTE as such is not enough.

The situation resembles 2007 – before the arrival of the iPhone. Incremental improvements had made products from e.g. Nokia the best ever, but disruption was needed to create new growth. iPhone was the catalyst in 2007. The mobile world – including Apple – are back into incremental improvements and the current products are the best ever. From where will the innovation come that creates new growth in mature markets?

How to best monetise mobile data: Providing fact-based recommendations

Analysis & Go-to-market, 2013

How are mobile operators monetising mobile data in Sweden, Finland, Norway, Denmark – and in a few other international markets? Which changes have operators made to their monetisation models during the past years? How have these changes affected business results and how has competition responded?

Based on these international facts and best practice, what would tefficient recommend when it comes to e.g. volume caps, overage policy, throughput tiers and shared plans? Taking local conditions, operator strategy and market position into account.

Commissioned by an operator.

Will ad-funded mobile fly this time?

blyk Remember Blyk? The high-profiled venture that targeted the young UK population with free calls and texts – if they agreed to received targeted advert texts on their mobiles. After launch in 2007, the UK service was shut down 2009. [The Blyk name still exists in e.g. the Netherlands where Vodafone uses the concept.]

wifogThe question is if Swedish ad-funded MVNO Wifog – launched yesterday – can make a similar concept fly. Wifog has realised that in 2013, people spend most of their device-interaction time connected to the Internet. Their proposition is therefore data-centric: Watch 2-5 minutes of video adverts a day (you can schedule these) and in return get unlimited data (on 3’s 3G network), 120 minutes of voice and 200 SMSs per month.

Wifog tells advertisers that they can reach the right audience – through targeting and analytics. It’s likely that Wifog’s users will be profiled based on what they use the Internet for – much more powerful than the orginal Blyk concept which was based on end-users selecting their “areas of interest”. The question is just how interesting this is for advertisers in a world where Google – without asking for our opt-in consent – already targets us with device-specific, location-specific and usage-based adverts.

How 4G LTE became mainstream (for some)

Examining the strategic choices of operators: At tefficient, we’ve been having our ears to the ground for some time picking up and summarising operator data on how 4G LTE adoption is developing globally. An absolute majority of operators who have launched 4G LTE still fail to report their 4G LTE customer number, their 4G LTE device penetration and their 4G LTE traffic level – but it’s on its way up.

4G LTE cube

And for those that do report, the third quarter of 2013 represents a shift: No longer is 4G LTE a niche service for a few early adopters – instead it is mainstream. At least in parts of the world.

Three criteria need to be fulfilled to be able to count a user as a 4G LTE user. This analysis introduces the 4G LTE cube which visualises the strategic choices operators have when it comes to all three. So far, strategies differ very much – and they affect adoption strongly.

Download analysis: tefficient public industry analysis 14 2013 LTE