Category Archives: Benchmarks

Nordic operator benchmark 2015

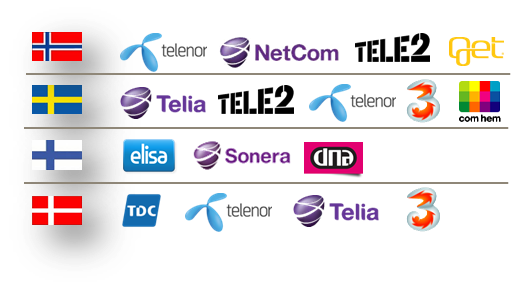
2015 Nordic benchmark potential participantsPress release

There are two major changes to this benchmark compared to 2013 and 2014:

  • The scope has been expanded from mobile operators to mobile, fixed/cable and integrated operators
  • The peer group country cluster has also been expanded: We now welcome Denmark as a complement to Sweden, Finland and Norway

In total, 16 operators (see above) will be invited to participate. As previous years, the identities of the actual participants will be confidential.

An operator can, depending on business scope, focus or budget, participate in one, two or three of the benchmarks: Mobile, fixed/cable and/or the integrated benchmark.

Integrated operators: Since the mobile-fixed mix is different from one integrated operator to another, integrated operators aren’t just compared “as is”. With tefficient‘s methodology, an operator’s actual mobile-fixed mix will be taken into account on a per-KPI basis making the integrated peer group totally relevant for this specific operator’s mobile-fixed mix.

Other modifications to the benchmark are: Improved comparability for equipment sales via subsidy and instalment models; M2M split-out; Improved comparability between telesales in incoming and outgoing calls; Improved comparability between “make or buy” in Networks OPEX & CAPEX; More detailed network quality KPIs.

Mobile benchmark: 603 KPIs derived from a maximum of 376 input data points

Fixed/cable benchmark: 549 KPIs derived from a maximum of 471 input data points

Integrated benchmark: 555 KPIs derived from a maximum of 594 input data points (stand-alone) or just 99 additional input data points (if mobile and fixed benchmarks done)

All three benchmarks cover revenue, OPEX, CAPEX, headcount productivity, performance, traffic & load, quality and innovation & growth for 33 functions.

Deadline to participate is 23 January 2015. Input data (FY 2014) frozen 20 March 2015. Results available 24 April 2015. If you’re among the 16 operators, please contact tefficient for an introduction.

Network sharing JV benchmark 2014

Network sharing benchmarkBenchmarks, 2014

For the second consecutive year: Comprehensive business benchmark including a total of 159 KPIs covering revenue, OPEX, CAPEX, productivity, traffic load and network quality – with a peer group solely consisting of network sharing joint ventures.

Due to pre-agreed confidentiality requirements, the identities of participating JVs are fully anonymous.

Once again, the results demonstrate the value of the JV-specfic benchmark approach: Network sharing JVs have throughfocus on core activities, higher freedom in selecting operation methods and attention to detail established cost and productivity levels that are elevated beyond the obvious sharing effect. Also network quality is very high even though traffic load increases when sharing. To improve further, JVs need to compare with their likes – other JVs – and not to regular mobile operators. The benchmark will run again in March 2015.

Telenor and ‘3’ sell more equipment than Telia and Tele2 – or?

TeliaSonera started to separate out equipment revenue in their new reporting format. Lovely!

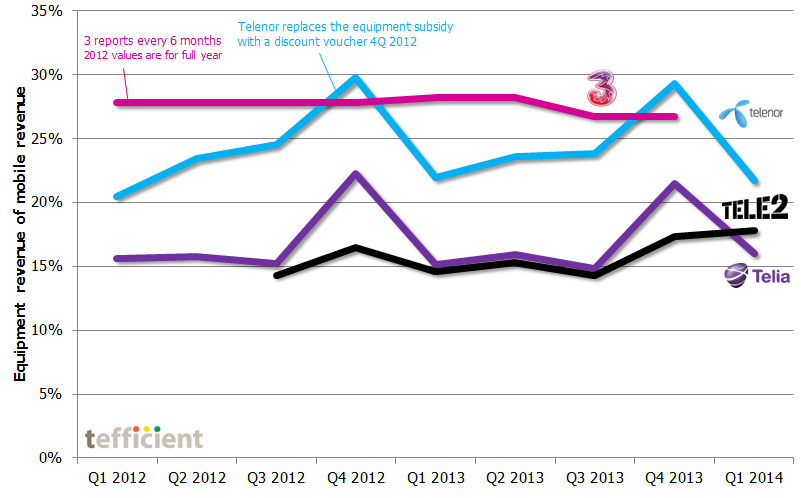
Sweden equipment revenue of mobile revenue ratio 2012 2014

We can now compare the equipment revenue vs. mobile revenue ratio for all Swedish operators (see graph). According to reporting notes, Telenor and ‘3’ realise the full equipment price as equipment revenue and let the equipment subsidy dilute service revenue instead. Telia and Tele2 realise the actual equipment sales price after subsidy as equipment revenue.

Active in the same market, there is likely no material difference between the equipment sales of the operators; the differences between Telenor/’3′ on one side and Telia/Tele2 on the other are rather a consequence of the revenue recognition used.

If so, we can by comparing these two approaches estimate that Swedish operators averagely subsidise around one third of the nominal equipment price. That is how much Telia and Tele2’s lines would have to be raised to match the lines of Telenor and ‘3’.

Sweden-Finland-Norway-specific mobile operator benchmark 2014

Sweden Finland NorwayFor the second consecutive year: Comprehensive business benchmark including a total of 577 KPIs covering revenue, OPEX, CAPEX, headcount productivity, subscriptions & channels, performance, load, quality and innovation & growth – for 33 functions within a mobile operator.

Peer group consisting exclusively of primary data from Swedish, Finnish and Norwegian operators. Due to pre-agreed confidentiality requirements, the identities of the participating operators are fully anonymous.

The results again demonstrate the value of a region-specific benchmark approach: Swedish, Finnish and Norwegian operators have global leadership in a wide array of business aspects and a global benchmark would therefore leave them without guidance on how to improve further. In contrast, participating operators now have a great tool to improve their local competitiveness even further. The benchmark will run again in January 2015 and then cover also Danish operators. Operators can participate either as a mobile entity or as an integrated (fixed and mobile) entity.

The risk of being too ungenerous with data allowance

The Danish mobile market – with 4 operators in a country with less than 6 million inhabitants – has always been very competitive and price-centric. So far, only the market leading incumbent TDC has fared relatively well – but the question is if that is about to change.

Unlike its competitors, TDC has been very restrictive with data allowances. TDC is still even restricting voice use on most of its plans.

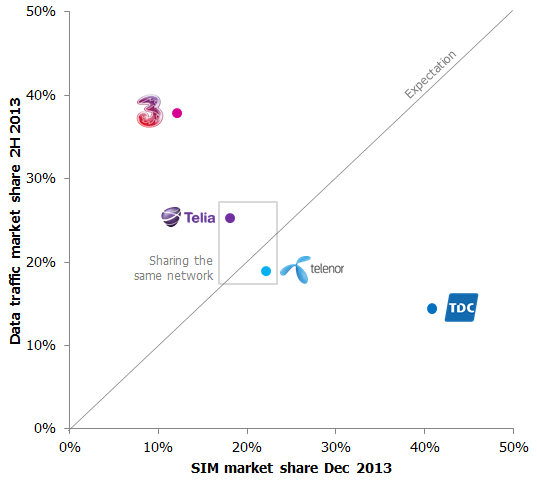
Denmark data usage vs SIM 2H 2013

At tefficient, we like regulators who publish not only the total usage volumes of their country, but break it down on the individual operators – like Erhvervsstyrelsen does for Denmark. The graph above compares the SIM market share with the data traffic market share: TDC has 41% of the Danish SIMs but just 14% of the data traffic. ‘3’ is TDC’s antipode: 12% of the SIMs but 38% of Denmark’s mobile data traffic.

Denmark 199 DKK plan contents

A comparison of what a mobile smartphone customer gets for 199 DKK [27 EUR] demonstrates the allowance difference well. What the table doesn’t show is that TDC gives significant multi-user discounts on more expensive plans – and that TDC allows every smartphone user to attach up to 3 data-SIMs under the same allowance without any additional fee. [Telenor has lately partly matched some of this].

Still, the mobile users with an interest for mobile data – undoubtedly the future – seem to prefer TDC’s competitors: The average TDC phone SIM used 250 Mbytes of data per month during 2H 2013. Telenor had 530, Telia 680 and ‘3’ 1170 Mbytes. The average TDC data-only SIM used 650 Mbytes. Telenor had 2600, Telia 4200 and ‘3’ 5100 Mbytes per month.

The competitive context has sharpened further as Telenor and Telia have launched their new, shared, network. A network test – ordered by Telenor – showed that the new Telenor/Telia network is best in Denmark. Marketing has had its point towards TDC.

In what appears to be a reaction, TDC has recently increased some of their data allowances – especially in the multi-user plans.

The case should serve as learning for operators in general: Whereas we’ve spoken much about the risk of being too generous with data allowance it’s perhaps time to address the risk of being too ungenerous?

Price erosion and low customer loyalty put mobile operators in Lithuania, Latvia and Estonia under pressure

LTLVEEPress release

For two years in a row, leading operators in Sweden, Finland and Norway have been benchmarked against a local operator peer group through a practice led by tefficient. The results reinforce the rationale behind local benchmarking: In order to improve, operators need focused, fact-based and local input.

It’s time to give a similar tool to mobile operators in Lithuania, Latvia and Estonia.

“We strongly feel something needs to be done”, says Allan Greve at tefficient. “Very little analysis focuses on the specifics of these three markets and we intend to change this.”

Presentation on benchmarking and the Dutch mobile market

Analysis & Consulting, 2014

Allan NLPresented to the members of the Ambassadors of Telecom organisation in the Netherlands 13 March 2014. The title was “Benchmarking – and the tale of a wing clipped Dutch opportunity”. In addition to tefficient’s approach to benchmarking, we discussed if there is a mobile data dilemma in the Netherlands (comparing to the rest of the world).

The presented slides can be viewed here.

Will ad-funded mobile fly this time?

blyk Remember Blyk? The high-profiled venture that targeted the young UK population with free calls and texts – if they agreed to received targeted advert texts on their mobiles. After launch in 2007, the UK service was shut down 2009. [The Blyk name still exists in e.g. the Netherlands where Vodafone uses the concept.]

wifogThe question is if Swedish ad-funded MVNO Wifog – launched yesterday – can make a similar concept fly. Wifog has realised that in 2013, people spend most of their device-interaction time connected to the Internet. Their proposition is therefore data-centric: Watch 2-5 minutes of video adverts a day (you can schedule these) and in return get unlimited data (on 3’s 3G network), 120 minutes of voice and 200 SMSs per month.

Wifog tells advertisers that they can reach the right audience – through targeting and analytics. It’s likely that Wifog’s users will be profiled based on what they use the Internet for – much more powerful than the orginal Blyk concept which was based on end-users selecting their “areas of interest”. The question is just how interesting this is for advertisers in a world where Google – without asking for our opt-in consent – already targets us with device-specific, location-specific and usage-based adverts.

How six months contracts changed mobile in Belgium and Denmark

Belgium churn analysis 12 2013 2Denmark has had it for more than 10 years, Belgium got it a year ago and now EU proposes it for all of EU: Maximum effective binding period of 6 months for consumer mobile contracts.

What happens to a mobile market when such a change is introduced and why is this change actually so significant?

This analysis shows that when Belgian consumers no longer are locked into long contracts, it has a major impact. The question is also if the transition is over in Belgium: Danish figures suggest it might get worse.

Since the EU commission – as part of the 11 September 2013 “Connected Continent: Building a Telecoms Single Market” plan – is proposing that EU consumers should have a similar right to cancel contracts after six months, the question is obviously: Is this also your future?

Download analysis: tefficient public industry analysis 12 2013 Six months contracts

Network sharing JV benchmark 2013

Network sharing benchmarkComprehensive business benchmark including a total of 129 KPIs covering revenue, OPEX, CAPEX, productivity, traffic load and network quality – with a peer group solely consisting of network sharing joint ventures.

Due to pre-agreed confidentiality requirements, the identities of participating JVs are fully anonymous.

The results demonstrate the value of the JV-specfic benchmark approach: Network sharing JVs have established cost and productivity levels that are elevated far beyond the obvious sharing effects. Also network quality levels are very high even though traffic load is higher. To improve further, JVs need to compare with their likes – other JVs – and not to regular mobile operators.