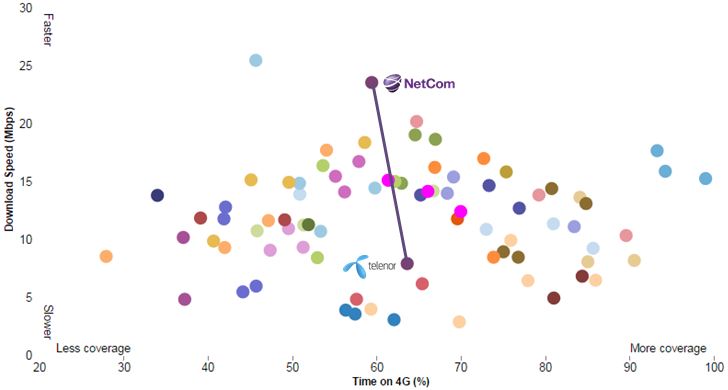
OpenSignal released its crowdsourced 4G speed and coverage stats for Q3 2015 today. The data was anonymously collected from a total of 325221 iOS and Android smartphone users globally during June to August.
We have compared the service prices of all mobile operator brands in eleven countries: Germany, the UK, France, the Netherlands, Belgium, Sweden, Austria, Switzerland, Denmark, Finland and Norway.
Vodafone Group is running an ambitious investment and modernisation programme called Project Spring.
And it is much needed: During the financial crisis in Europe, Vodafone lost millions of customers who found that other brands did not only have lower prices, but often also better service. It took time for Vodafone to react, but Project Spring is now addressing the investment backlog of Vodafone. Continue reading What is “perfect voice” anyhow?→
For the third consecutive year: Comprehensive business benchmark including a total of 159 KPIs covering revenue, OPEX, CAPEX, TCO, productivity, traffic load and network quality – with a peer group solely consisting of network sharing joint ventures. Continue reading Network sharing JV benchmark 2015→
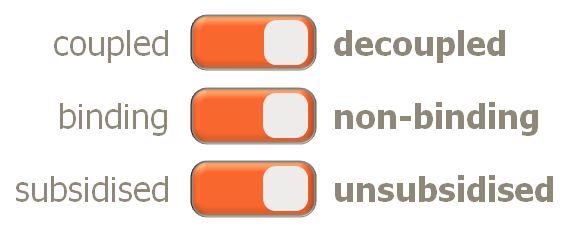
Decoupled, non-binding, unsubsidised: A game changer?
Our analysis shows that mature market mobile operators on average use 15-20% of service revenue on subscriber acquisition and subscriber retention cost (SAC/SRC). In most cases without growing.
For the third consecutive year: Comprehensive business benchmark including more than 500 KPIs covering revenue, OPEX, CAPEX, headcount productivity, subscriptions & channels, performance, load, quality and innovation & growth – for 33 functions within a mobile operator, within a fixed/cable operator and/or within an integrated operator – respectively. Continue reading Nordic operator benchmark 2015→
Consumers often think of carriers being somewhat stuffy and dusty, being slow to give customers flexibility and big at small print. But there are great exceptions to the rule with T-Mobile in the US, Free in France and Tele2 in Sweden, and we believe the next two years will see some further fun, entertaining and disruptive carrier offerings on the market. Continue reading Freedom to stay – The power of 40000 Tweets→
We’ve been awaiting Telenor’s official comments to OpenSignal’s new crowdsourced 4G coverage and speed test, but since Telenor hasn’t yet commented it we try to interpret the Norwegian results ourselves.