T-Mobile in the Netherlands continues its rally towards higher EBITDA margin: One year ago, it was 28%. Now it’s 43%. T-Mobile’s reported figures shows just how sensitive sales costs are to the mobile business margin.
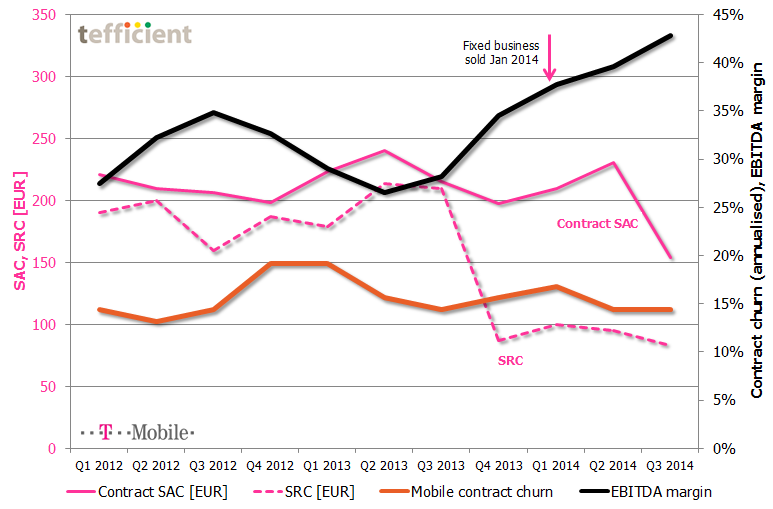
In Q4 2013, T-Mobile cut its subscriber retention cost (SRC) from a level above 200 EUR to less than half. It has stayed at the new, lower, level since. Even though done during fourth quarter – where margin normally is weak due to seasonal sales – T-Mobile’s EBITDA margin took a leap upwards quarter-to-quarter. Another leap came in Q1 2014 when T-Mobile sold its fixed business (traded under the “Online” brand).
In the just-reported third quarter, T-Mobile’s EBITDA margin took yet a leap: This time due to a significant reduction in contract SAC (subscriber acquisition cost).
The text book says that such dramatic reductions in SAC/SRC would immediately penalise T-Mobile who would experience a shrinking base and market share since existing customers would churn out and new customers would’t join. The interesting thing is that existing customers haven’t left: The orange curve shows a stabilising contract churn of about 15%. T-Mobile has, however, still experienced a decline in their total base, but this has mainly been within prepaid. [The reported reduction in Q3 was almost exclusively to the disposal of the Simpel brand].
According to T-Mobile, the answer to how this has been possible comes in two parts:
- Increasing mobile data usage and revenue
- Increasing revenue from equipment
In a market where T-Mobile’s two current MNO competitors KPN and Vodafone both go in the converged multi-play direction, it will be interesting to follow if T-Mobile can stay on this route – especially as Tele2 is about to enter the Dutch market as MNO within short.