Analysis and Go-to-market, 2014
Download the analysis, commissioned by Comptel ![]() and published 2 June 2014 here.
and published 2 June 2014 here.
Analysis and Go-to-market, 2014
Download the analysis, commissioned by Comptel ![]() and published 2 June 2014 here.
and published 2 June 2014 here.
The Danish mobile market – with 4 operators in a country with less than 6 million inhabitants – has always been very competitive and price-centric. So far, only the market leading incumbent TDC has fared relatively well – but the question is if that is about to change.
Unlike its competitors, TDC has been very restrictive with data allowances. TDC is still even restricting voice use on most of its plans.
At tefficient, we like regulators who publish not only the total usage volumes of their country, but break it down on the individual operators – like Erhvervsstyrelsen does for Denmark. The graph above compares the SIM market share with the data traffic market share: TDC has 41% of the Danish SIMs but just 14% of the data traffic. ‘3’ is TDC’s antipode: 12% of the SIMs but 38% of Denmark’s mobile data traffic.

A comparison of what a mobile smartphone customer gets for 199 DKK [27 EUR] demonstrates the allowance difference well. What the table doesn’t show is that TDC gives significant multi-user discounts on more expensive plans – and that TDC allows every smartphone user to attach up to 3 data-SIMs under the same allowance without any additional fee. [Telenor has lately partly matched some of this].
Still, the mobile users with an interest for mobile data – undoubtedly the future – seem to prefer TDC’s competitors: The average TDC phone SIM used 250 Mbytes of data per month during 2H 2013. Telenor had 530, Telia 680 and ‘3’ 1170 Mbytes. The average TDC data-only SIM used 650 Mbytes. Telenor had 2600, Telia 4200 and ‘3’ 5100 Mbytes per month.
The competitive context has sharpened further as Telenor and Telia have launched their new, shared, network. A network test – ordered by Telenor – showed that the new Telenor/Telia network is best in Denmark. Marketing has had its point towards TDC.
In what appears to be a reaction, TDC has recently increased some of their data allowances – especially in the multi-user plans.
The case should serve as learning for operators in general: Whereas we’ve spoken much about the risk of being too generous with data allowance it’s perhaps time to address the risk of being too ungenerous?
The reporting of Telefónica, PT and Orange show that quad-play is a hit in Spain, Portugal and France. Vodafone used 14,9 billion EUR to acquire cablecos in Germany and Spain – to enable quad.
Operators need to be realistic about the positives quad-play can bring and use facts to spot best practice. tefficient’s framework provides a great start if entering quad – or facing competition that do.
For two years in a row, leading operators in Sweden, Finland and Norway have been benchmarked against a local operator peer group through a practice led by tefficient. The results reinforce the rationale behind local benchmarking: In order to improve, operators need focused, fact-based and local input.
It’s time to give a similar tool to mobile operators in Lithuania, Latvia and Estonia.
“We strongly feel something needs to be done”, says Allan Greve at tefficient. “Very little analysis focuses on the specifics of these three markets and we intend to change this.”
 We look at what happened to the MVNO businesses when Orange, SFR and Bouygues launched their sub-brands Sosh, Red and B&YOU during second half of 2011 in preparation for the announced launch of Free mobile.
MVNOs were once the challengers typically differentiating through targeted segmentation or price – or both. With the emergence of MNO sub-brands one could fear for what happens to MVNOs in a market.
Download analysis: tefficient public industry analysis 3 2014 Impact of sub-brands on MVNOs
Since last year, BT is on a route so far not tried by other telcos. In August 2013, BT Sport was launched: A new TV channel which acquired the exclusive rights to show many of the Premier League football games in the UK. Previously, these rights were with satellite and TV provider Sky.
If you want to see Premier League football, you need to become a customer of BT Sport. But that isn’t BT’s primary proposition: Instead, they want you to become a BT broadband customer – since then you get BT Sport included for free. BT uses the sports rights as a tool to strengthen their retail market share in fixed broadband and TV. And that’s an innovation.
The graph shows how BT’s broadband net adds have developed: In a mature market, BT adds more broadband customers after the BT Sport launch than before. 6,8 million customers in June 2013 grew to 7,3 million in March 2014.
But is comes with a high price: In its year to March 2014 report, BT says it spent 450 MGBP (or 3,6% of the total OPEX of BT Group) on BT Sport during the year. Programming rights were 203 MGBP of this. All this is OPEX; the BT Sport related CAPEX was spent last year.
In March, BT had 3 million direct BT Sport customers. In total, BT Sport is in 5 million UK homes. The additional 2 million come via the wholesale agreements BT later have done with e.g. Virgin Media and Sky. Even though these agreements bring revenue to BT (BT Sport e.g. costs 12 GBP per month if you are a Sky customer), they work against the idea of using BT Sport as an acquisition and retention tool for BT broadband.
Future will show if BT Sport became a game changer for BT. So far, it’s been a lot of money: Roughly 3000 GBP of OPEX per additional broadband net add since the BT Sport introduction.
 At tefficient, we’ve built a comprehensive before/after analysis framework of the results operators have achieved when transforming their offers from single-service to quad-play.
There are many indications that quad-play is about to become the new European standard: Telekom will go quad-play in Germany during 2014; Vodafone has acquired Kabel Deutschland and Ono to go beyond mobile-only; TeliaSonera reorganised 1 April to converge fixed and mobile on a national basis.
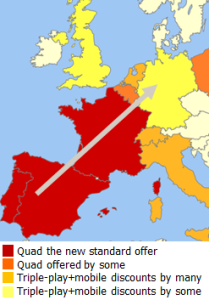
Quad is propagating over Europe with south-westerly winds. The map above shows the wind direction: From Portugal, Spain and France towards Central and North Europe.

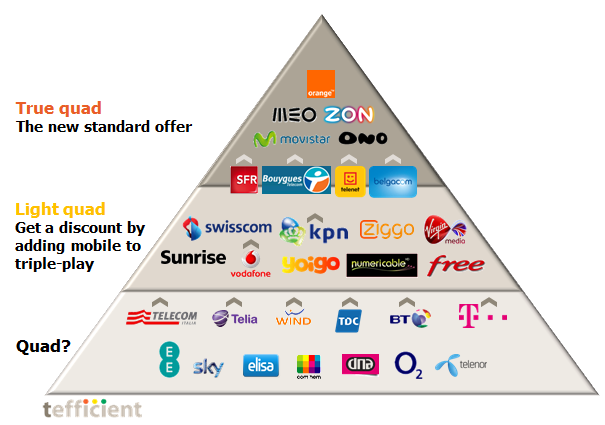
The first step towards true quad is often what we call light quad – a discount that a customer gets if he or she adds mobile to triple-play. In this case, it’s typically not very prominent in operator’s marketing, there’s typically no product brand name, and far from the straight-forward pitch of true quad operators.
The current position of European operators – who have quad capability – is seen in our quad pyramid above. The arrows indicate operators that are seen to take action to move upwards.
Through our before/after analysis, we’ve spotted several very interesting outcomes – best as well as worst practices. These can be used to either prepare your own journey into quad – or understand how to best defend against quad-capable competitors.
Analysis & Go-to-market, 2014
 Preparing analysis and facilitating workshops on 4G LTE and fibre adoptionwith over 40 of Comptel’s operator customers from around the world as part of Comptel’s Focus Group in Helsinki 25-26 March 2014.
 This is our fourth analysis on subscriber acquisition cost (SAC) and subscriber retention cost (SRC). Previous SAC & SRC analyses showed that an increase in SRC had a positive effect on contract churn without any negative effect on EBITDA – as long as not exceeding 100% of contract SAC.
Our new analysis shows that much has happened in 2013: Average unit SAC and SRC have decreased significantly. How come – and what has it led to?
Based on data from 35 mobile operators in 24 mature markets globally.
The analysis comes in two versions: A public version which you can download below – and a premium version which adds country-specific SAC & SRC analyses on eight countries: France, Germany, Poland, Austria, the Netherlands, UK, Denmark and Canada.
Download public version: tefficient industry analysis 2 2014 SAC vs SRC – public version
Analysis & Consulting, 2014
 Presented to the members of the Ambassadors of Telecom organisation in the Netherlands 13 March 2014. The title was “Benchmarking – and the tale of a wing clipped Dutch opportunity”. In addition to tefficient’s approach to benchmarking, we discussed if there is a mobile data dilemma in the Netherlands (comparing to the rest of the world).
The presented slides can be viewed here.