Not counting social media activity – LinkedIn and Twitter – tefficient had 40 000 unique visitors at tefficient.com and nonstopretention.com in the last twelve months.
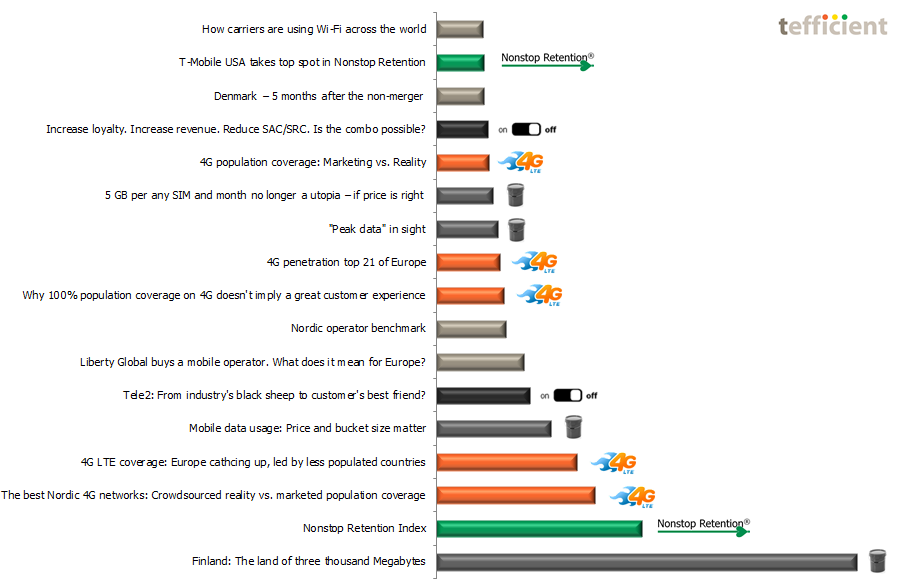
Here’s what you read the most (click to enlarge):
![]() Mobile data usage and price analysis continues to be popular: 13% of all visitors accessed the four analyses in the top list.
Mobile data usage and price analysis continues to be popular: 13% of all visitors accessed the four analyses in the top list.
![]() The five listed adoption and coverage comparisons on 4G LTE attracted 10% of all visitors.
The five listed adoption and coverage comparisons on 4G LTE attracted 10% of all visitors.
The two Nonstop Retention pages in the top list attracted 5% of all visitors.
![]() Visitors are also interested in non-subsidy and non-binding models for equipment sales – 3% of all visitors read and downloaded the top-two analyses on this subject.
Visitors are also interested in non-subsidy and non-binding models for equipment sales – 3% of all visitors read and downloaded the top-two analyses on this subject.
In case you missed any of the most popular analyses – here’s a quick reference list:
- Finland: The land of three thousand Megabytes Mar 2015
- Nonstop Retention Index Sep 2015
- The best Nordic 4G networks: Crowdsourced reality vs. marketed population coverage Sep 2015
- 4G LTE coverage: Europe cathcing up, led by less populated countries Dec 2014
- Mobile data usage: Price and bucket size matter Jun 2015
- Tele2: From industry’s black sheep to customer’s best friend? Mar 2015
- Liberty Global buys a mobile operator. What does it mean for Europe? Apr 2015
- Nordic operator benchmark Oct 2015
- Why 100% population coverage on 4G doesn’t imply a great customer experience Mar 2015
- 4G penetration top 21 of Europe May 2015
- “Peak data” in sight Dec 2014
- 5 GB per any SIM and month no longer a utopia – if price is right Jan 2016
- 4G population coverage: Marketing vs. Reality Apr 2015
- Increase loyalty. Increase revenue. Reduce SAC/SRC. Is the combo possible? Jun 2015
- Denmark – 5 months after the non-merger Feb 2016
- T-Mobile USA takes top spot in Nonstop Retention Sep 2015
- How carriers are using Wi-Fi across the world Nov 2015

