Whereas the “Europe is behind” accusation today is a myth rather than a fact when it comes to 4G LTE rollout, Europe still has an issue when it comes to really fast, two-way, fixed broadband – something only fiber-to-the-home (FTTH) or fiber-to-the-building (FTTB) networks can deliver. Continue reading Copper Europe?
All posts by Fredrik Jungermann
Churn: Still a concern
The subsidy model – which dominated operators’ handset and equipment sales in mature markets for decades – is rightfully retiring. It wasn’t a brilliant idea to discount goods not produced inhouse (taking cost pressure away from equipment manufacturers like Apple) and, to compensate, overcharge for the services actually produced (making over-the-top services and Wi-Fi more attractive). Continue reading Churn: Still a concern
4G LTE coverage: Europe catching up, led by less populated countries
For a long time, lobbyists used the 4G LTE rollout and -adoption discrepancy between US and Korea/Japan (on one hand) and Europe (on the other hand) as a “proof” of too rigid European telecom regulation.
The basic fact that major US, Korean and Japanese operators are running CDMA2000 without the European possibility to gracefully migrate to 4G LTE was tactically neglected in this comparison. Continue reading 4G LTE coverage: Europe catching up, led by less populated countries
You do have blind spots. Spot them.
The last day to confirm participation in the Nordic operator benchmark 2015 is 23 January.
A few operators have confirmed their participation already, but since we 2015 expand the scope of the benchmark from mobile to mobile, fixed/cable and integrated operators (respectively) and add Denmark, there are a few operators who have been asked for the first time.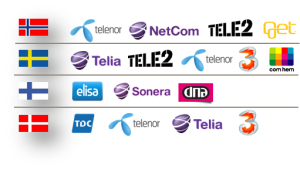
The operators who are asked are displayed.
You of course ask “why should I“?
To become aware of your blind spots. To measure and compare is to know. If you don’t participate, you blind spots will remain blind spots. You might even think you don’t have any.
If you don’t participate, you don’t know where competition is – and you don’t know what is local best practice.
If you do participate, you will get your business measured and compared to a relevant, local, unadjusted peer group.
33 functions are covered within these six domains:
- Marketing & sales
- Customer service
- Networks
- IT
- Support functions
- Product development
 There are around 600 KPIs per each benchmark (mobile, fixed/cable, integrated):
- 80 revenue,
- 130 OPEX,
- 15 CAPEX,
- 130 productivity,
- 90 subscribers & channel,
- 70 performance,
- 50 load,
- 10 quality and,
- 10 innovation & growth KPIs
The KPIs are carefully selected for each function – and have been improved in cooperation with the operators having participated in 2013 and 2014.
Your position is only showed to yourself. The identities of the actual participants are anonymous. The data is not used for any other purposes than this benchmark. That’s our confidentiality promise.
We also promise a 100% fact based benchmark where no numbers have been “adjusted”.
Think again. You do have blind spots. Spot them.
More information: Nordic operator benchmark 2015
“Peak data” in sight
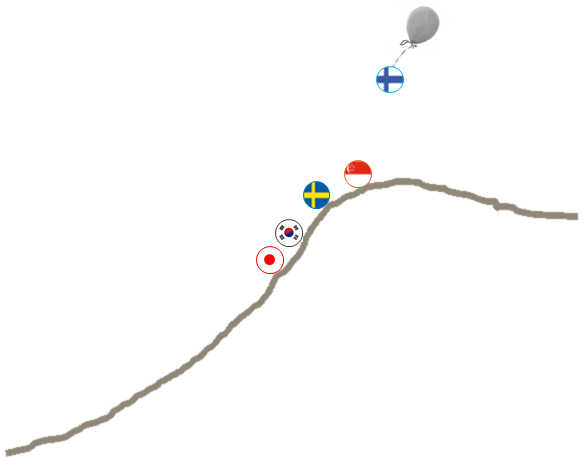 This is tefficient’s 10th public analysis on the development of mobile data usage. For the first time, we see clear signs of saturation.
Operators’ squeeze-out of unlimited customers continues. The growth in smartphone penetration has levelled out in high usage markets. 4G is becoming mainstream. Public Wi-Fi starts to disrupt.
Are we approaching “peak data”?
Download analysis: tefficient industry analysis 7 2014 mobile data usage peak ver 2
New operator Wi-Fi analysis: Straight to the top
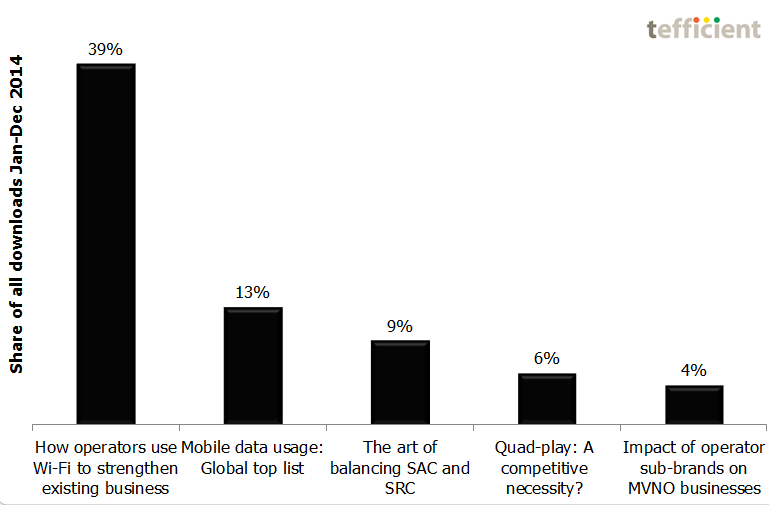
Our new public analysis of How operators use Wi-Fi to strengthen existing business went right into the No 1 position of most downloaded in 2014 – even though it was made available as late as 8 December.
The presentation at the Wi-Fi Innovation Summit seems to have created a lot of interest: The analysis was downloaded 800 times in the two weeks thereafter.
You’ll find the other top 5 analyses – and a few more – at the Analysis page.
Speaker at the Wi-Fi Innovation Summit
Analysis & Consulting, 2014
 Preparing and presenting “How are telcos, cellcos and cablecos using Wi-Fi to strengthen existing business?” for 200 participants at the Wi-Fi Innovation Summit in Copenhagen 9-10 December.
Some of the presented content is available in this analysis.
How operators use Wi-Fi to strengthen existing business
 Wi-Fi has become a tool in the operator toolbox. In this analysis – our third on the subject – we show how telcos, cellcos and cablecos use Wi-Fi to strengthen existing business. It’s a mixture of hotspots, homespots and new business models.
Time is right for operators to include Wi-Fi into a combined connectivity experience for customers – a carrier-grade experience. This analysis contains the best practices and the motivation you need.
Download analysis: tefficient public industry analysis 6 2014 How operators use Wi-Fi to strengthen existing business
O2 is better for BT than EE – it might even be a love marriage
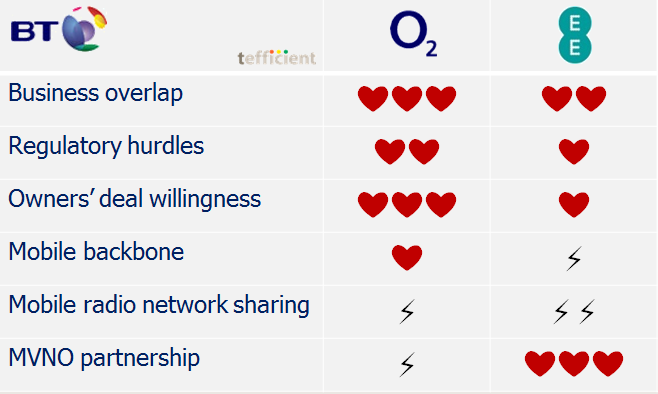
BT confirmed yesterday that they are in talks with two mobile operators about a possible merger in the UK – one being O2. EE is believed to be the other. To assist BT, tefficient presents a matchmaking table.
Business overlap: Since O2 last year sold its fixed business to Sky, a BT-O2 marriage means a minimal business overlap. EE is not bad as a partner either; EE’s fixed business is small. What complicates is that EE recently positioned itself in the upcoming quad-play market through the launch of EE TV. But it helps that EE didn’t enter the same content arena as BT to compete with e.g. BT Sport.
Regulatory hurdles: It took EU a year or more to agree to the mergers of ‘3’ and Orange in Austria, of ‘3’ and O2 in Ireland and of O2 and E-plus in Germany. These mergers were all consolidating mobile operators. Numericable, a French cable operator, received green light from French authorities to acquire SFR, an integrated operator, in just six months (and EU kept out). Since the experience from the merger in Austria is that prices went up, the new EU commission is believed to be more skeptical to mergers which increase market consolidation. A merger between BT and O2 would create a giant, but with the old way of looking at it (fixed and mobile are separate markets), approval might be as easy as in Numericable-SFR. A marriage with EE is somewhat more complicated since it would be a merger of two No 1 operators (in fixed and mobile respectively) plus, of course, the fact that EE today is competing with BT in fixed (and TV).
Owners’ deal willingness: Telefónica, who owns O2, sold O2 branded operations in Ireland and Czech Republic in 2013. Telefónica was behind O2’s entry into UK fixed market in 2006-2007, but demonstrated deal willingness when it was sold to Sky last year. Telefónica has also merged its O2 operation in Germany with E-plus. With all these deals in mind and with a need to control debt after the acquisition in Germany and the upcoming GVT acquisition in Brazil, Telefónica is so ready to sell. EE, on the other hand, has been surrounded by rumours on deals and IPOs, but EE’s owners have recently put an end to it saying that time is not now. The 50/50 ownership split between Orange and Deutsche Telekom makes decisions on EE slow.
Mobile backbone: O2 has continued to rely on BT as a provider not only for backbone transmission but also for field engineering services. EE has sourced much of its backbone from BT’s competitor Virgin Media.
Mobile radio network sharing: Regardless of choosing O2 or EE, BT will get a third party involved through network sharing within mobile. In O2’s case, that sharing partner is Vodafone (who recently said they would go after BT also in the consumer business in the UK), but O2 and Vodafone never went further than sharing passive infrastructure like masts and transmission. Marrying EE would bring ‘3‘ to the table since EE shares network with ‘3’. In contrast to O2/Vodafone, the EE/’3′ network sharing is based on sharing also active infrastructure like radio equipment. It’s not a showstopper, but calls for more coordination.
MVNO partnership: At last, a category where a marriage with EE would be the easiest: BT has a fresh MVNO agreement with EE which grants BT’s mobile customers access to EE’s network. In spite of being part of BT until 2001, O2 never had such an agreement with BT; it was Vodafone who was BT’s host prior to the change to EE this year.
To conclude, both O2 and EE would be good partners to BT. But a marriage with O2 would be quicker to the altar and contain more love. Hopefully.
Identifying non-traditional initiatives to increase efficiency
Analysis & Consulting, 2014
Independently identifying and presenting customer-specific initiatives to increase efficiency to a key customer operator of a global services provider.

