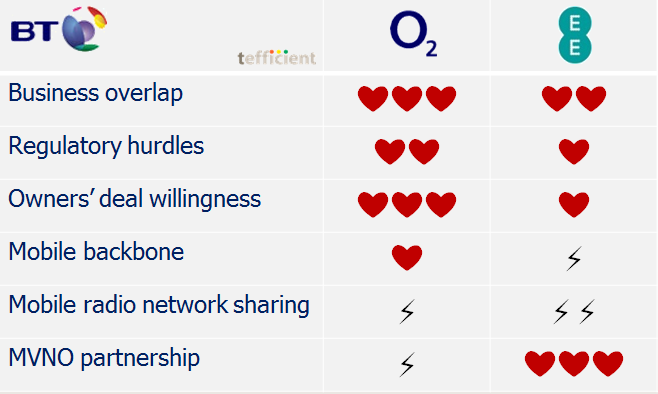
All posts by Fredrik Jungermann

Network sharing JV benchmark 2014

Network sharing benchmarkBenchmarks, 2014

For the second consecutive year: Comprehensive business benchmark including a total of 159 KPIs covering revenue, OPEX, CAPEX, productivity, traffic load and network quality – with a peer group solely consisting of network sharing joint ventures.

Due to pre-agreed confidentiality requirements, the identities of participating JVs are fully anonymous.

Once again, the results demonstrate the value of the JV-specfic benchmark approach: Network sharing JVs have throughfocus on core activities, higher freedom in selecting operation methods and attention to detail established cost and productivity levels that are elevated beyond the obvious sharing effect. Also network quality is very high even though traffic load increases when sharing. To improve further, JVs need to compare with their likes – other JVs – and not to regular mobile operators. The benchmark will run again in March 2015.

EU’s largest mobile operator born. But has EplusO2 passed best before date?

45 million SIMs: The combined EplusO2 will be the largest mobile operator in Germany and in the European Union. A mobile giant was in practice born today with EU’s approval of Telefónica’s acquisition of E-plus.

But during the more than 11 months of approval, the competitive playground changed:

  • Vodafone acquired Kabel Deutschland and is about to integrate it in order to offer quad-play
  • Telekom developed a new strategy, bringing quad-play to Germany during 2014

Germany revenue dev 2012 2014

Realising that the future battlefield won’t be mobile-only, we should understand how EplusO2 would rank when it comes to integrated revenue. See the graph above.

When we sum up O2 and E-plus (dotted line), we are no longer looking at market leader. EplusO2 will be number 3.

E-plus is (and has always been) mobile-only. O2 has a fixed arm in Germany, but its share of integrated revenue is just about 25% (and much of it relates to wholesale). What’s worse from a quad-play perspective is that O2 discontinued its TV product by the end of 2013. It never gained more than 90 000 customers – nothing in a country with a population of 82 million.

Telefónica might have something up their sleeve, but the question still has to be asked: Has the mobile-only scale logic behind the merger of O2 and E-plus passed best before date?

Telenor and ‘3’ sell more equipment than Telia and Tele2 – or?

TeliaSonera started to separate out equipment revenue in their new reporting format. Lovely!

Sweden equipment revenue of mobile revenue ratio 2012 2014

We can now compare the equipment revenue vs. mobile revenue ratio for all Swedish operators (see graph). According to reporting notes, Telenor and ‘3’ realise the full equipment price as equipment revenue and let the equipment subsidy dilute service revenue instead. Telia and Tele2 realise the actual equipment sales price after subsidy as equipment revenue.

Active in the same market, there is likely no material difference between the equipment sales of the operators; the differences between Telenor/’3′ on one side and Telia/Tele2 on the other are rather a consequence of the revenue recognition used.

If so, we can by comparing these two approaches estimate that Swedish operators averagely subsidise around one third of the nominal equipment price. That is how much Telia and Tele2’s lines would have to be raised to match the lines of Telenor and ‘3’.

Sweden-Finland-Norway-specific mobile operator benchmark 2014

Sweden Finland NorwayFor the second consecutive year: Comprehensive business benchmark including a total of 577 KPIs covering revenue, OPEX, CAPEX, headcount productivity, subscriptions & channels, performance, load, quality and innovation & growth – for 33 functions within a mobile operator.

Peer group consisting exclusively of primary data from Swedish, Finnish and Norwegian operators. Due to pre-agreed confidentiality requirements, the identities of the participating operators are fully anonymous.

The results again demonstrate the value of a region-specific benchmark approach: Swedish, Finnish and Norwegian operators have global leadership in a wide array of business aspects and a global benchmark would therefore leave them without guidance on how to improve further. In contrast, participating operators now have a great tool to improve their local competitiveness even further. The benchmark will run again in January 2015 and then cover also Danish operators. Operators can participate either as a mobile entity or as an integrated (fixed and mobile) entity.

The risk of being too ungenerous with data allowance

The Danish mobile market – with 4 operators in a country with less than 6 million inhabitants – has always been very competitive and price-centric. So far, only the market leading incumbent TDC has fared relatively well – but the question is if that is about to change.

Unlike its competitors, TDC has been very restrictive with data allowances. TDC is still even restricting voice use on most of its plans.

Denmark data usage vs SIM 2H 2013

At tefficient, we like regulators who publish not only the total usage volumes of their country, but break it down on the individual operators – like Erhvervsstyrelsen does for Denmark. The graph above compares the SIM market share with the data traffic market share: TDC has 41% of the Danish SIMs but just 14% of the data traffic. ‘3’ is TDC’s antipode: 12% of the SIMs but 38% of Denmark’s mobile data traffic.

Denmark 199 DKK plan contents

A comparison of what a mobile smartphone customer gets for 199 DKK [27 EUR] demonstrates the allowance difference well. What the table doesn’t show is that TDC gives significant multi-user discounts on more expensive plans – and that TDC allows every smartphone user to attach up to 3 data-SIMs under the same allowance without any additional fee. [Telenor has lately partly matched some of this].

Still, the mobile users with an interest for mobile data – undoubtedly the future – seem to prefer TDC’s competitors: The average TDC phone SIM used 250 Mbytes of data per month during 2H 2013. Telenor had 530, Telia 680 and ‘3’ 1170 Mbytes. The average TDC data-only SIM used 650 Mbytes. Telenor had 2600, Telia 4200 and ‘3’ 5100 Mbytes per month.

The competitive context has sharpened further as Telenor and Telia have launched their new, shared, network. A network test – ordered by Telenor – showed that the new Telenor/Telia network is best in Denmark. Marketing has had its point towards TDC.

In what appears to be a reaction, TDC has recently increased some of their data allowances – especially in the multi-user plans.

The case should serve as learning for operators in general: Whereas we’ve spoken much about the risk of being too generous with data allowance it’s perhaps time to address the risk of being too ungenerous?

Is quad-play just a response to weakened customer loyalty in triple-play? With mobile as giveaway?

quad signPress release

The reporting of Telefónica, PT and Orange show that quad-play is a hit in Spain, Portugal and France. Vodafone used 14,9 billion EUR to acquire cablecos in Germany and Spain – to enable quad.

Operators need to be realistic about the positives quad-play can bring and use facts to spot best practice. tefficient’s framework provides a great start if entering quad – or facing competition that do.

Price erosion and low customer loyalty put mobile operators in Lithuania, Latvia and Estonia under pressure

LTLVEEPress release

For two years in a row, leading operators in Sweden, Finland and Norway have been benchmarked against a local operator peer group through a practice led by tefficient. The results reinforce the rationale behind local benchmarking: In order to improve, operators need focused, fact-based and local input.

It’s time to give a similar tool to mobile operators in Lithuania, Latvia and Estonia.

“We strongly feel something needs to be done”, says Allan Greve at tefficient. “Very little analysis focuses on the specifics of these three markets and we intend to change this.”

BT Sport: 450 MGBP spent this year. Does it pay off?

Since last year, BT is on a route so far not tried by other telcos. In August 2013, BT Sport was launched: A new TV channel which acquired the exclusive rights to show many of the Premier League football games in the UK. Previously, these rights were with satellite and TV provider Sky.

BT broadband before after BT Sport

If you want to see Premier League football, you need to become a customer of BT Sport. But that isn’t BT’s primary proposition: Instead, they want you to become a BT broadband customer – since then you get BT Sport included for free. BT uses the sports rights as a tool to strengthen their retail market share in fixed broadband and TV. And that’s an innovation.

The graph shows how BT’s broadband net adds have developed: In a mature market, BT adds more broadband customers after the BT Sport launch than before. 6,8 million customers in June 2013 grew to 7,3 million in March 2014.

But is comes with a high price: In its year to March 2014 report, BT says it spent 450 MGBP (or 3,6% of the total OPEX of BT Group) on BT Sport during the year. Programming rights were 203 MGBP of this. All this is OPEX; the BT Sport related CAPEX was spent last year.

In March, BT had 3 million direct BT Sport customers. In total, BT Sport is in 5 million UK homes. The additional 2 million come via the wholesale agreements BT later have done with e.g. Virgin Media and Sky. Even though these agreements bring revenue to BT (BT Sport e.g. costs 12 GBP per month if you are a Sky customer), they work against the idea of using BT Sport as an acquisition and retention tool for BT broadband.

Future will show if BT Sport became a game changer for BT. So far, it’s been a lot of money: Roughly 3000 GBP of OPEX per additional broadband net add since the BT Sport introduction.