Tefficient will, as usual, publish a comprehensive analysis of the mobile data usage and revenue development across key markets globally.
The reporting of the country regulators happens when it happens and when enough of countries are finished, we will put the analysis for the full year of 2025 together.
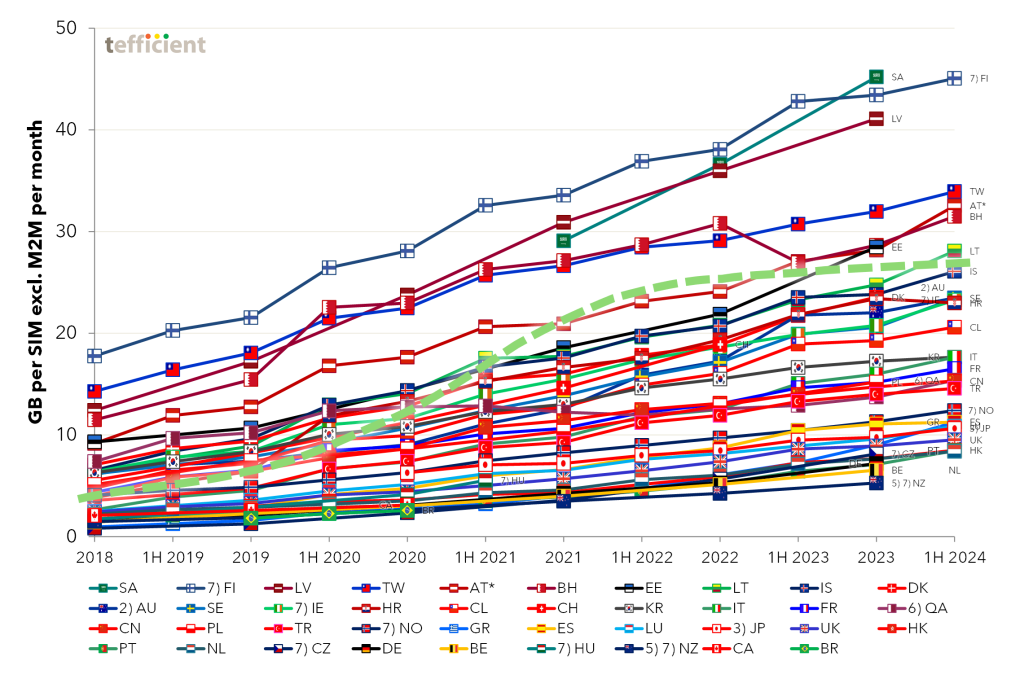
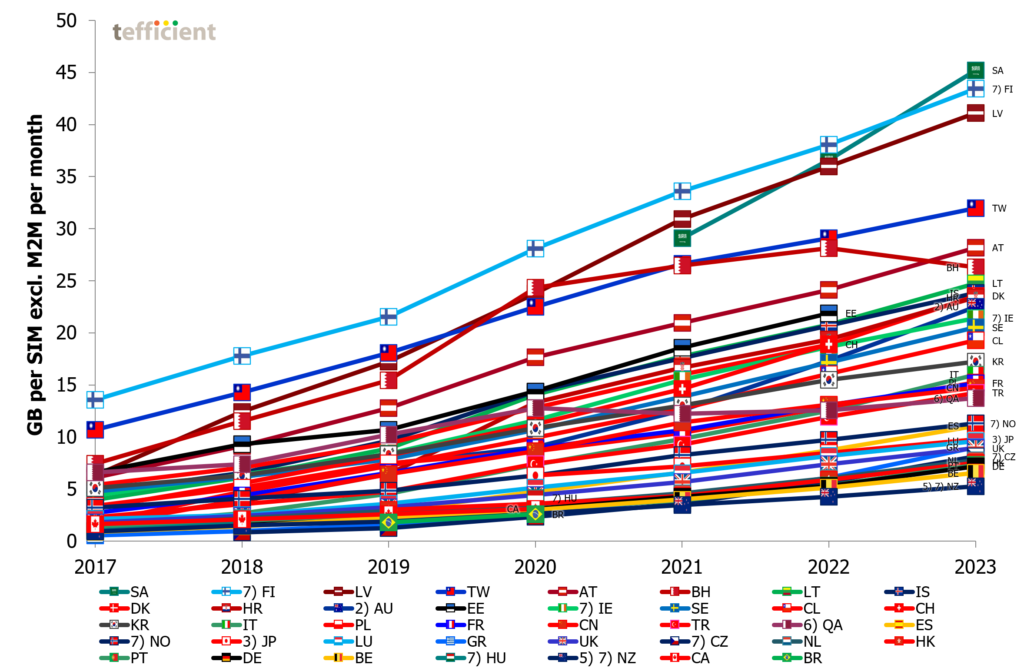
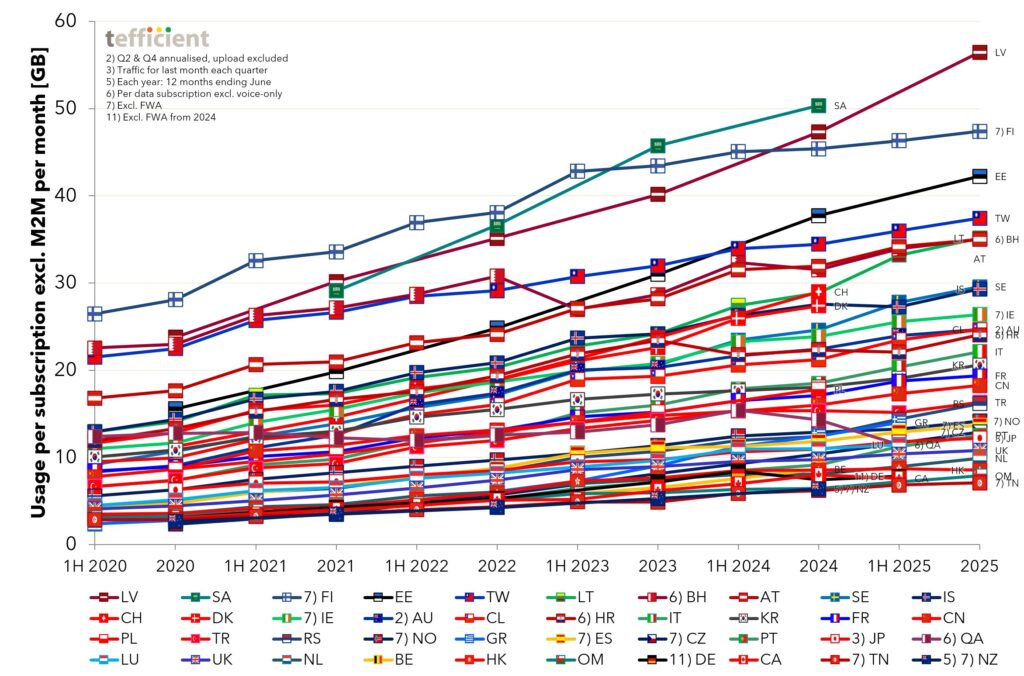
In the meantime, here’s the front page graph showing the development in the average mobile data usage per non-M2M subscription.
We will update it a few times in the coming days and weeks until the analysis can be finished.
The graph above (update #4) is from 5 June 2026 and updated with latest figures from Iceland.
The previous report, issued in November-December 2025, is here: