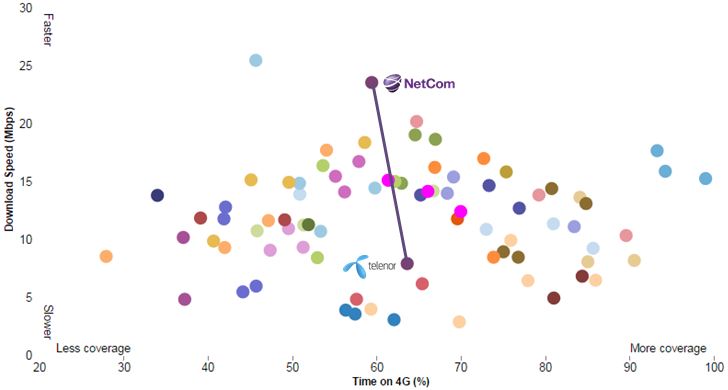
You do have blind spots. Spot them.

The last day to confirm participation in the Nordic operator benchmark 2015 is 23 January.

A few operators have confirmed their participation already, but since we 2015 expand the scope of the benchmark from mobile to mobile, fixed/cable and integrated operators (respectively) and add Denmark, there are a few operators who have been asked for the first time.2015 Nordic benchmark potential participants

The operators who are asked are displayed.


You of course ask “why should I“?

To become aware of your blind spots. To measure and compare is to know. If you don’t participate, you blind spots will remain blind spots. You might even think you don’t have any.

If you don’t participate, you don’t know where competition is – and you don’t know what is local best practice.

If you do participate, you will get your business measured and compared to a relevant, local, unadjusted peer group.

33 functions are covered within these six domains:

  • Marketing & sales
  • Customer service
  • Networks
  • IT
  • Support functions
  • Product development

KPIThere are around 600 KPIs per each benchmark (mobile, fixed/cable, integrated):

  • 80 revenue,
  • 130 OPEX,
  • 15 CAPEX,
  • 130 productivity,
  • 90 subscribers & channel,
  • 70 performance,
  • 50 load,
  • 10 quality and,
  • 10 innovation & growth KPIs

The KPIs are carefully selected for each function – and have been improved in cooperation with the operators having participated in 2013 and 2014.

Your position is only showed to yourself. The identities of the actual participants are anonymous. The data is not used for any other purposes than this benchmark. That’s our confidentiality promise.

We also promise a 100% fact based benchmark where no numbers have been “adjusted”.

Think again. You do have blind spots. Spot them.

More information: Nordic operator benchmark 2015

“Peak data” in sight

Peak dataThis is tefficient’s 10th public analysis on the development of mobile data usage. For the first time, we see clear signs of saturation.

Operators’ squeeze-out of unlimited customers continues. The growth in smartphone penetration has levelled out in high usage markets. 4G is becoming mainstream. Public Wi-Fi starts to disrupt.

Are we approaching “peak data”?

Download analysis: tefficient industry analysis 7 2014 mobile data usage peak ver 2

New operator Wi-Fi analysis: Straight to the top

Our new public analysis of How operators use Wi-Fi to strengthen existing business went right into the No 1  position of most downloaded in 2014 – even though it was made available as late as 8 December.

Most downloaded 2014 2


The presentation at the Wi-Fi Innovation Summit seems to have created a lot of interest: The analysis was downloaded 800 times in the two weeks thereafter.

You’ll find the other top 5 analyses – and a few more – at the Analysis page.

How operators use Wi-Fi to strengthen existing business

Wi-Fi dollarWi-Fi has become a tool in the operator toolbox. In this analysis – our third on the subject – we show how telcos, cellcos and cablecos use Wi-Fi to strengthen existing business. It’s a mixture of hotspots, homespots and new business models.

Time is right for operators to include Wi-Fi into a combined connectivity experience for customers – a carrier-grade experience. This analysis contains the best practices and the motivation you need.

Download analysis: tefficient public industry analysis 6 2014 How operators use Wi-Fi to strengthen existing business


O2 is better for BT than EE – it might even be a love marriage

BT plus O2 or EE tefficient


BT confirmed yesterday that they are in talks with two mobile operators about a possible merger in the UK – one being O2. EE is believed to be the other. To assist BT, tefficient presents a matchmaking table.

Business overlap: Since O2 last year sold its fixed business to Sky, a BT-O2 marriage means a minimal business overlap. EE is not bad as a partner either; EE’s fixed business is small. What complicates is that EE recently positioned itself in the upcoming quad-play market through the launch of EE TV. But it helps that EE didn’t enter the same content arena as BT to compete with e.g. BT Sport.

Regulatory hurdles: It took EU a year or more to agree to the mergers of ‘3’ and Orange in Austria, of ‘3’ and O2 in Ireland and of O2 and E-plus in Germany. These mergers were all consolidating mobile operators. Numericable, a French cable operator, received green light from French authorities to acquire SFR, an integrated operator, in just six months (and EU kept out). Since the experience from the merger in Austria is that prices went up, the new EU commission is believed to be more skeptical to mergers which increase market consolidation. A merger between BT and O2 would create a giant, but with the old way of looking at it (fixed and mobile are separate markets), approval might be as easy as in Numericable-SFR. A marriage with EE is somewhat more complicated since it would be a merger of two No 1 operators (in fixed and mobile respectively) plus, of course, the fact that EE today is competing with BT in fixed (and TV).

Owners’ deal willingness: Telefónica, who owns O2, sold O2 branded operations in Ireland and Czech Republic in 2013. Telefónica was behind O2’s entry into UK fixed market in 2006-2007, but demonstrated deal willingness when it was sold to Sky last year. Telefónica has also merged its O2 operation in Germany with E-plus. With all these deals in mind and with a need to control debt after the acquisition in Germany and the upcoming GVT acquisition in Brazil, Telefónica is so ready to sell. EE, on the other hand, has been surrounded by rumours on deals and IPOs, but EE’s owners have recently put an end to it saying that time is not now. The 50/50 ownership split between Orange and Deutsche Telekom makes decisions on EE slow.

Mobile backbone: O2 has continued to rely on BT as a provider not only for backbone transmission but also for field engineering services. EE has sourced much of its backbone from BT’s competitor Virgin Media.

Mobile radio network sharing: Regardless of choosing O2 or EE, BT will get a third party involved through network sharing within mobile. In O2’s case, that sharing partner is Vodafone (who recently said they would go after BT also in the consumer business in the UK), but O2 and Vodafone never went further than sharing passive infrastructure like masts and transmission. Marrying EE would bring ‘3‘ to the table since EE shares network with ‘3’. In contrast to O2/Vodafone, the EE/’3′ network sharing is based on sharing also active infrastructure like radio equipment. It’s not a showstopper, but calls for more coordination.

MVNO partnership: At last, a category where a marriage with EE would be the easiest: BT has a fresh MVNO agreement with EE which grants BT’s mobile customers access to EE’s network. In spite of being part of BT until 2001, O2 never had such an agreement with BT; it was Vodafone who was BT’s host prior to the change to EE this year.

To conclude, both O2 and EE would be good partners to BT. But a marriage with O2 would be quicker to the altar and contain more love. Hopefully.

How to improve EBITDA margin from 28% to 43% in 12 months

T-Mobile in the Netherlands continues its rally towards higher EBITDA margin: One year ago, it was 28%. Now it’s 43%. T-Mobile’s reported figures shows just how sensitive sales costs are to the mobile business margin.

T-Mobile NL SAC SRC EBITDA churn dev

In Q4 2013, T-Mobile cut its subscriber retention cost (SRC) from a level above 200 EUR to less than half. It has stayed at the new, lower, level since. Even though done during fourth quarter – where margin normally is weak due to seasonal sales – T-Mobile’s EBITDA margin took a leap upwards quarter-to-quarter. Another leap came in Q1 2014 when T-Mobile sold its fixed business (traded under the “Online” brand).

In the just-reported third quarter, T-Mobile’s EBITDA margin took yet a leap: This time due to a significant reduction in contract SAC (subscriber acquisition cost).

The text book says that such dramatic reductions in SAC/SRC would immediately penalise T-Mobile who would experience a shrinking base and market share since existing customers would churn out and new customers would’t join. The interesting thing is that existing customers haven’t left: The orange curve shows a stabilising contract churn of about 15%. T-Mobile has, however, still experienced a decline in their total base, but this has mainly been within prepaid. [The reported reduction in Q3 was almost exclusively to the disposal of the Simpel brand].

According to T-Mobile, the answer to how this has been possible comes in two parts:

  • Increasing mobile data usage and revenue
  • Increasing revenue from equipment

In a market where T-Mobile’s two current MNO competitors KPN and Vodafone both go in the converged multi-play direction, it will be interesting to follow if T-Mobile can stay on this route – especially as Tele2 is about to enter the Dutch market as MNO within short.

Quad and convergent play: tefficient provides fact-based recommendations

quad signAnalysis & Go-to-market, 2014

How have operators introduced mobile-fixed convergent quad-play in Europe’s most advanced markets France, Spain, Portugal – and in emerging quad markets like Belgium, the Netherlands, the UK and Germany? How has competition reacted?

Using facts: How have these quad introductions affected market share, churn, acquisition & retention cost, demand for mobile, fibre-speed broadband and TV – and revenue and margin? Which defensive actions can non-convergent operators take?

Which factors can be attributed to effective take-up of quad play? Market share, fibre deployment and homepass, TV offers, exclusive content – or is it just about bundling discounts? What discount levels are we talking about?

Based on international facts and best practice, what would tefficient recommend? Taking local conditions, operator strategy and market position into account.

Commissioned by two operators.

Nordic operator benchmark 2015

2015 Nordic benchmark potential participantsPress release

There are two major changes to this benchmark compared to 2013 and 2014:

  • The scope has been expanded from mobile operators to mobile, fixed/cable and integrated operators
  • The peer group country cluster has also been expanded: We now welcome Denmark as a complement to Sweden, Finland and Norway

In total, 16 operators (see above) will be invited to participate. As previous years, the identities of the actual participants will be confidential.

An operator can, depending on business scope, focus or budget, participate in one, two or three of the benchmarks: Mobile, fixed/cable and/or the integrated benchmark.

Integrated operators: Since the mobile-fixed mix is different from one integrated operator to another, integrated operators aren’t just compared “as is”. With tefficient‘s methodology, an operator’s actual mobile-fixed mix will be taken into account on a per-KPI basis making the integrated peer group totally relevant for this specific operator’s mobile-fixed mix.

Other modifications to the benchmark are: Improved comparability for equipment sales via subsidy and instalment models; M2M split-out; Improved comparability between telesales in incoming and outgoing calls; Improved comparability between “make or buy” in Networks OPEX & CAPEX; More detailed network quality KPIs.

Mobile benchmark: 603 KPIs derived from a maximum of 376 input data points

Fixed/cable benchmark: 549 KPIs derived from a maximum of 471 input data points

Integrated benchmark: 555 KPIs derived from a maximum of 594 input data points (stand-alone) or just 99 additional input data points (if mobile and fixed benchmarks done)

All three benchmarks cover revenue, OPEX, CAPEX, headcount productivity, performance, traffic & load, quality and innovation & growth for 33 functions.

Deadline to participate is 23 January 2015. Input data (FY 2014) frozen 20 March 2015. Results available 24 April 2015. If you’re among the 16 operators, please contact tefficient for an introduction.

Measure, compare and improve competitiveness within telecoms