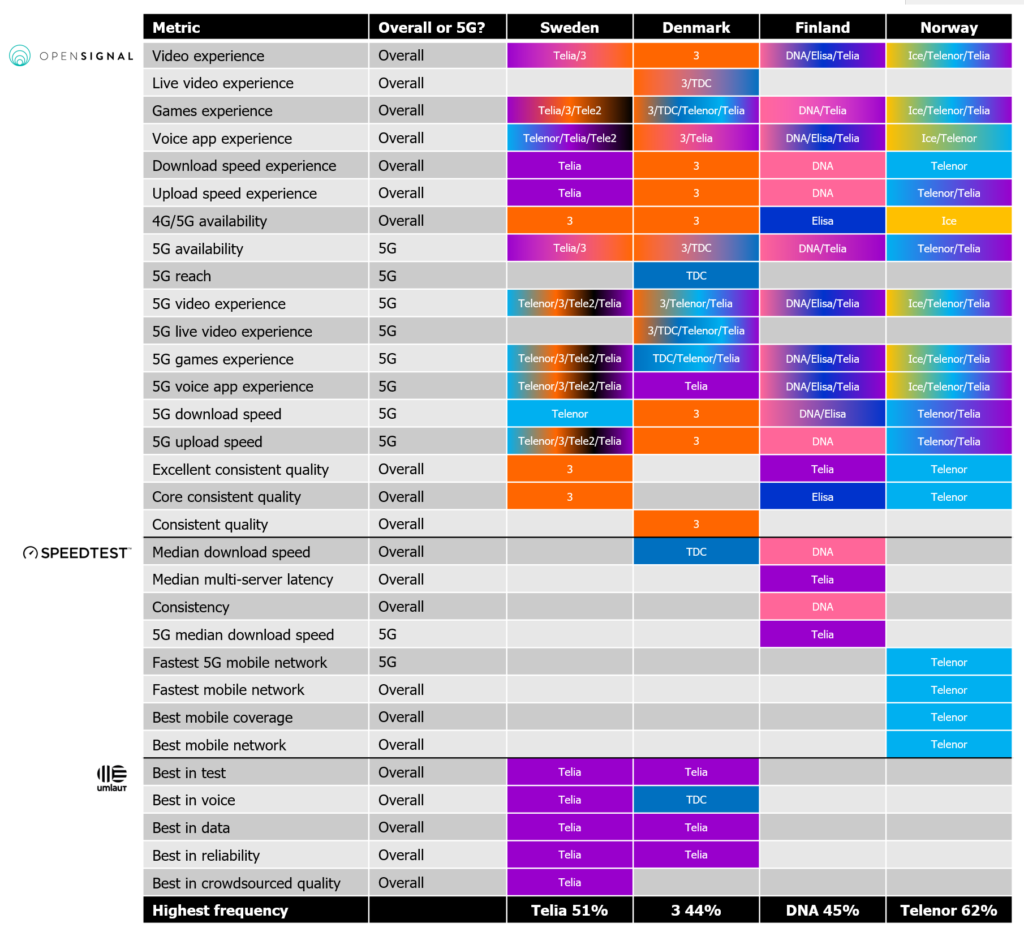
But there are several companies – some with global, some with local ambitions – that offer their take on who has the best mobile network. To differentiate, providers define different metrics and use different methodologies. Rather than boring you with those, we have compiled a cross-case table naming the winner per each metric across three global network experience specialists: Opensignal (now having merged with Tutela), Ookla Speedtest and umlaut.
We have included the latest overall or 5G-specific tests made public in Q4 2022 or 2023.
Tefficient, in its 38th public analysis of mobile data trends, has ranked 116 operators based on metrics like average data usage per subscription, total data traffic and revenue per gigabyte. This issue covers the full year of 2022 and the first half of 2023.
Notably, 97% of operators witnessed an upswing in data usage per subscription in 2022, with 75% of them successfully translating this into increased ARPU.
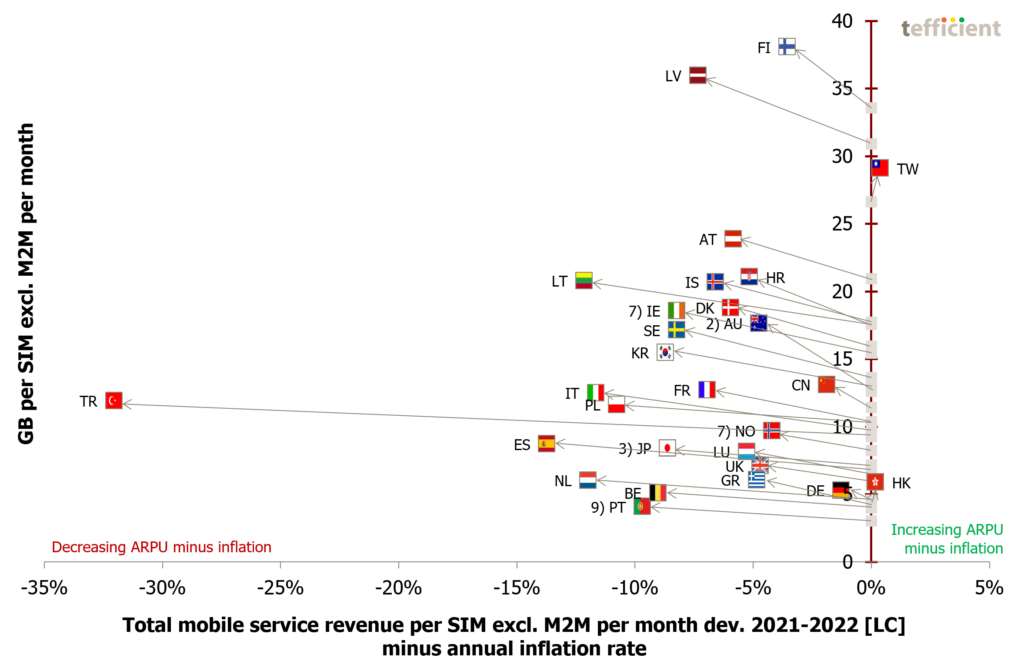
Tefficient’s 37th public analysis of mobile data development and drivers compares trends across 37 countries worldwide, excluding M2M/IoT from the total bases.
Previous analyses have shown that the pandemic led to a significant increase in mobile data usage. However, the demand for more mobile data has since slowed down. In 2022, Czechia experienced the highest growth rate in mobile data usage, reaching 59%. At the other end of the spectrum, Qatar and Taiwan had relatively lower increases, both below 9%.
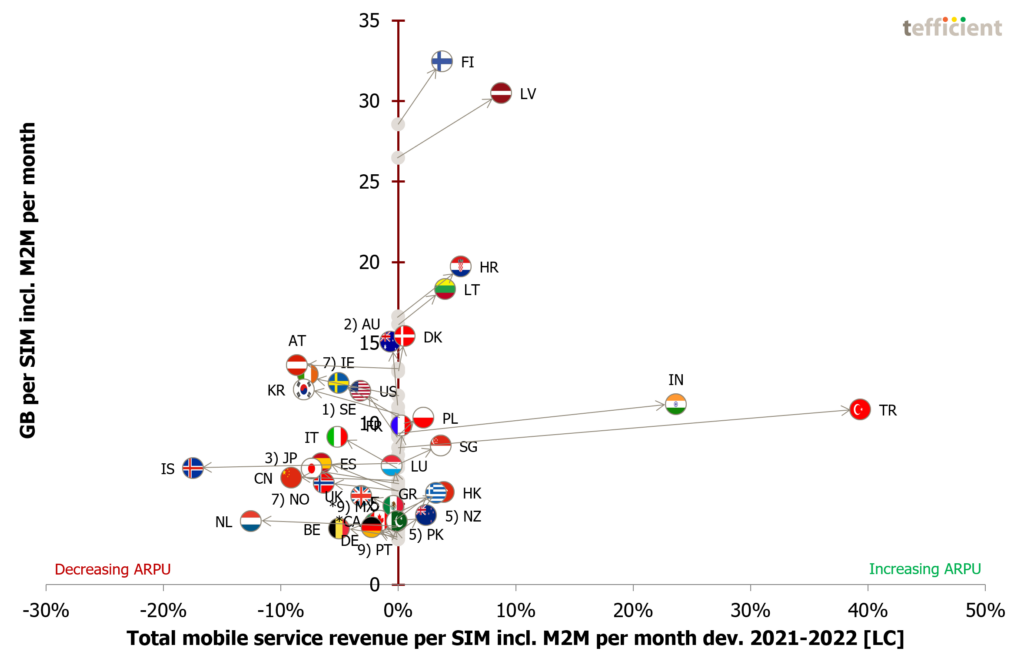
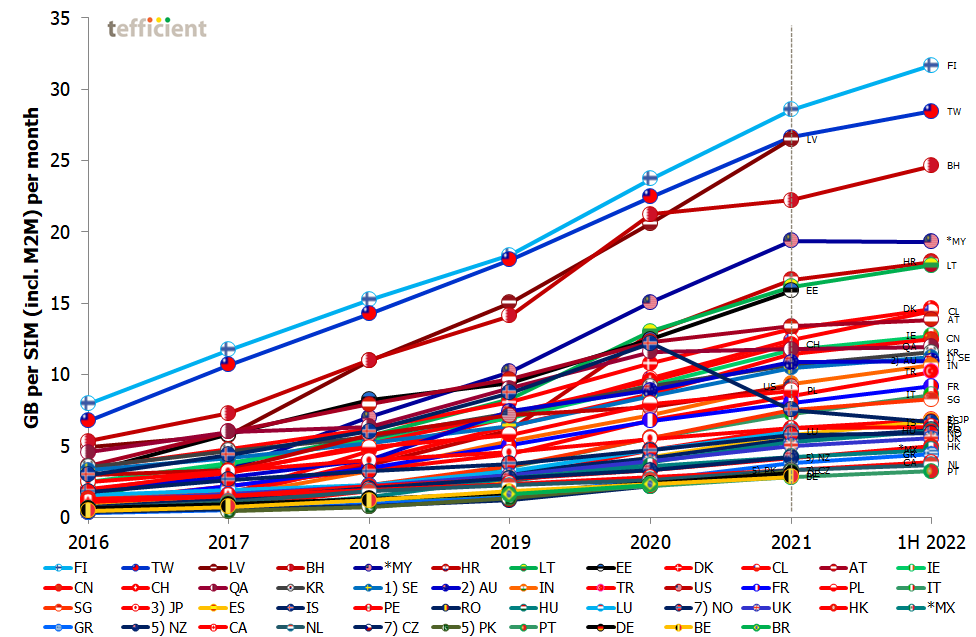
Tefficient’s 36th public analysis of the development and drivers of mobile data compares the trends of 45 countries globally.
In our previous analyses, we saw that the pandemic led to an increase in the mobile data usage. The demand for more mobile data has since slowed. Czechia experienced the fastest growth in mobile data usage in 2022: 56%. On the other end of the spectrum, Iceland witnessed a decrease in usage. Austria, China, Malaysia and Norway had some increase, but it was below 9%.
Tefficient conducted a series of one-to-one interviews with operator executives from various global markets to gain insights into their perspectives on mobile data monetisation and service bundling models, with a focus on current and future trends.
The interviews delved into topics such as the sufficiency of current bucket and unlimited tiered mobile data propositions, the pricing of 5G, the success of speed tiering, and how content bundling can help operators. Experiences from hard bundling, soft bundling (with choice), add-on sales and content aggregation were discussed. Additionally, the interviews explored how operators can design their propositions in a QoE and slicing future where tiering is not limited to volume, speed, and content.
Tefficient’s 35th public analysis of the development and drivers of mobile data compares the trends of 46 countries from around the world. In our previous reports, we observed that the pandemic drove an increase in mobile data usage. However, during the second half of 2021 and into 2022, the demand for more mobile data slowed.
Greece experienced the fastest growth in mobile data usage, with a 45% increase. On the other end of the spectrum, Qatar, Peru, Malaysia, and Austria saw unusually slow growth rates of just 1-3%.
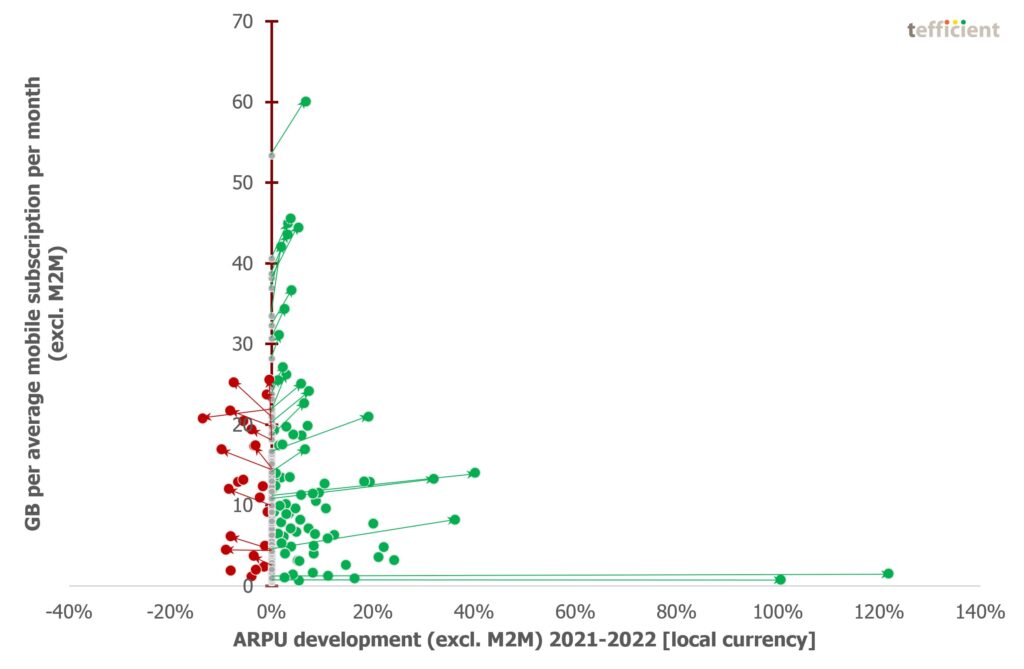
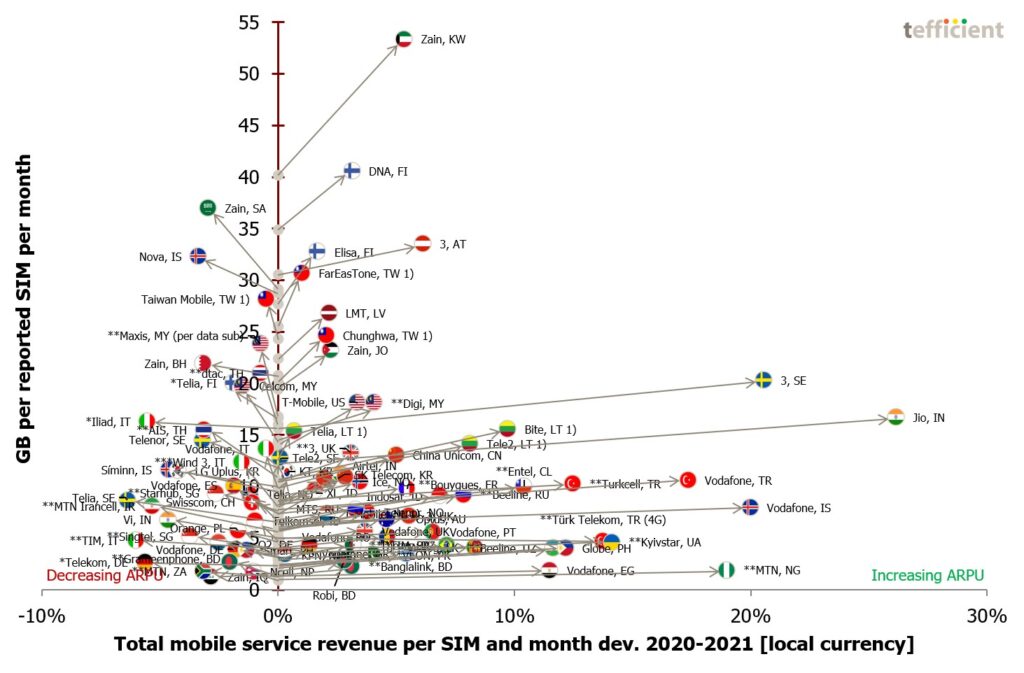
Tefficient’s 34th public analysis on the development and drivers of mobile data ranks 104 operators based on average data usage per SIM, total data traffic and revenue per gigabyte in the full year of 2021 and in the first half of 2022.
In 2021 – a year marked by COVID – the data usage per SIM grew for 97% of operators. The average traffic growth was 32%. A majority of operators, 62%, could turn data usage growth into ARPU growth.
62% of operators could turn data usage growth into ARPU growth
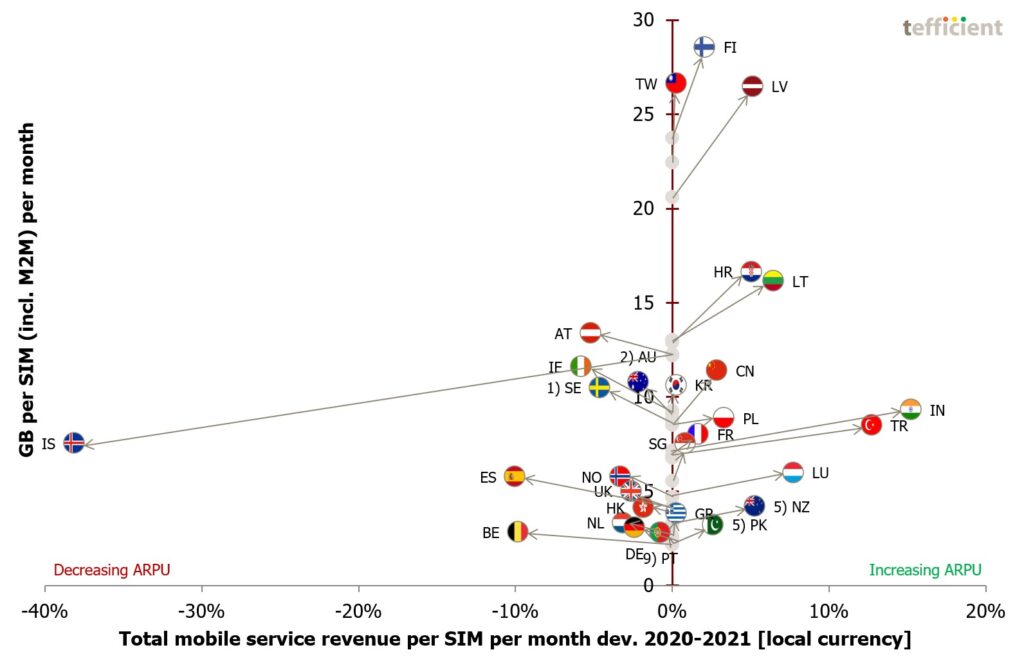
Tefficient’s 33rd public analysis of the development and drivers of mobile data compares 46 countries from all regions of the world.
In our previous reports for 2020 and 1H 2021 we could see that the pandemic drove mobile data usage – contrary to the belief that all that time we spent at home would offload mobile data traffic to Wi-Fi and fixed broadband.
But the usage backlash is here: During the second half of 2021 the demand for more mobile data slowed. If comparing countries where usage is available for both the first and the second half of the year, most experienced decelerating growth. There were even five countries with a decline in absolute usage: Australia, Iceland, Qatar, Austria and Bahrain.
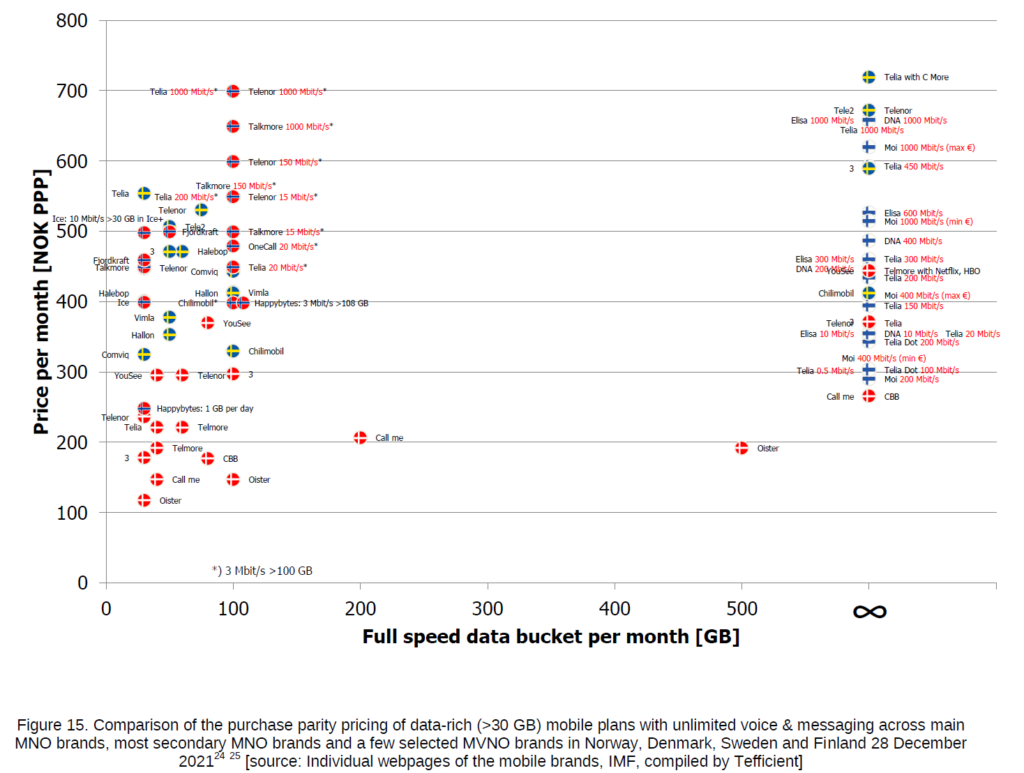
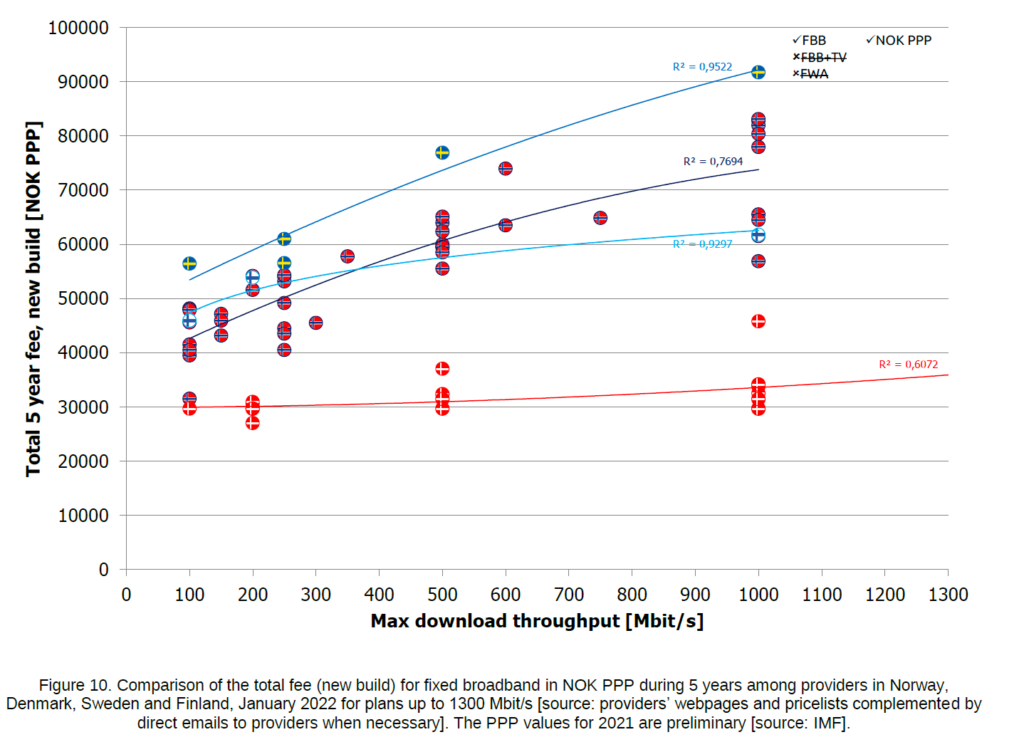
Both analyses are quite comprehensive and compare Norway to the three fellow Nordic countries Denmark, Sweden and Finland. It means that they are highly interesting not just for the industry and policy makers in Norway, but in all four countries.
Sample graph from the mobile reportSample graph from the fixed broadband report
Since the Ministry has made both analyses available for public download, you can access them directly and for free from here:
Gaming is a multi-billion dollar business – but operators have not really aimed to monetise it. Until now. Cloud gaming relies on a network’s ability to deliver a stable throughput and a low and stable latency. Gaming devices no longer need to have muscles; the rendering happens in powerful cloud servers. With cloud gaming, operators have the possibility to be relevant for gamers; operators can use network features to control and improve the gaming experience. Perhaps operators can even sell cloud gaming with differentiated experience tiers?