
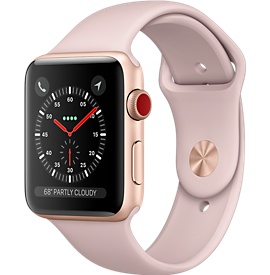
 It’s here. I’ve been salivating after the latest Apple Watch 3, with all the bells and whistles. Slick, beautiful, cool and I’ll only need a watch to make/receive calls and text, stream music, etc. This should be easy, I’ll just pre-order the GPS & Cellular version. I’m a UK consumer and have a passion for all things mobile & telco, both home and abroad. Therefore, I decided to find out how Apple Watch 3 offers compare in the UK, USA and Australia. Continue reading Apple Watch 3 Cellular, how much data does it eat?
European 4G – mission accomplished?
Look at the graph below. It should satisfy mobile end-users, operators, regulators, politicians and equipment suppliers.
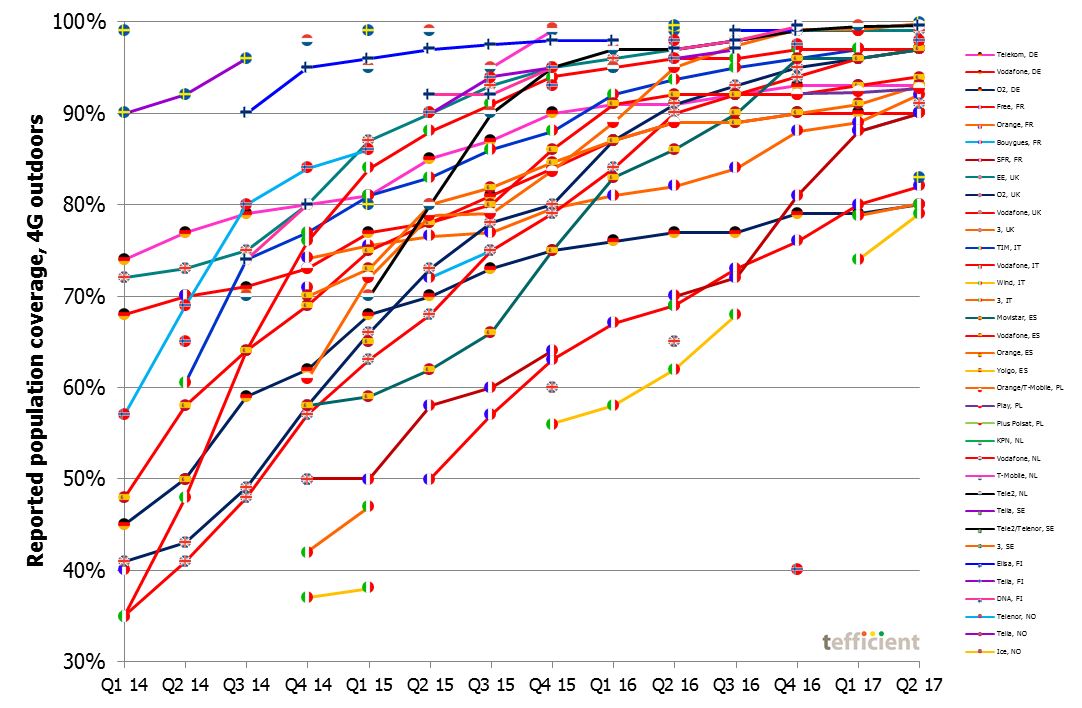
It shows that all operators have improved 4G coverage to the extent that they all (well almost) reach above 90% of the population by the end of June.
Mission accomplished then? Continue reading European 4G – mission accomplished?
Is high mobile data usage cannibalising fixed?
We have published numerous analyses on mobile data usage. The two latest are:
- Country comparison: “More for more” isn’t happening
- Operator comparison: The luxury of the commodity gigabyte
Our readers also know that we follow operator Wi-Fi closely, see e.g. this piece.
 At tefficient, we believe that the world is (or is about to become) mobile-first. But it doesn’t mean that the mobile networks will carry most of the traffic. In contrast, as shown in this post based on OpenSignal data, the regular smartphone user is most often more on Wi-Fi than on mobile networks. And when the smartphone is on Wi-Fi, the traffic volume is often higher since fixed broadband users seldom have to worry about data caps. Mobile operating systems are also set up to prefer (or in the case of upgrades, mandate) Wi-Fi. All Wi-Fi traffic ends up on the fixed access network, not on the mobile access network.
We don’t take a side in the tiring conflict between the cellular camp and the Wi-Fi camp and will continue to argue that it’s not cellular or Wi-Fi, it’s cellular and Wi-Fi. It’s not licensed or unlicensed spectrum, it’s licensed and unlicensed.
For this post we have, for the first time, gathered reported fixed data usage stats from regulators and operators globally to try to answer two questions:
- Are countries with low mobile data usage having higher fixed broadband usage? I.e. is fixed broadband compensating?
- Are countries with high mobile data usage having lower fixed broadband usage? I.e. is mobile ‘cannibalising’ fixed?
Continue reading Is high mobile data usage cannibalising fixed?
The luxury of the commodity gigabyte
Data usage, traffic and revenue per GB for 111 operators

This is tefficient’s 16th public analysis on the development and drivers of mobile data.
It is an add-on to our just-published analysis “More for more” isn’t happening which compares 33 countries.
In this analysis we compare operators. We have ranked 111 of them based on: Continue reading The luxury of the commodity gigabyte
“More for more” isn’t happening
Cherish “more for the same” – it’s the best you get
For the 15th time: tefficient’s data usage and revenue analysis
 The usage continued to grow in 2016, but the spread in growth rates has never been greater between markets. Singapore, Japan, Hong Kong and, surprisingly, USA grew the slowest whereas Poland, Lithuania, Romania, Austria and France grew the fastest. Continue reading “More for more” isn’t happening
Network sharing JV benchmark 2017
Benchmarks, 2017
For the fifth consecutive year: Comprehensive business benchmark including a total of 164 revenue, OPEX, CAPEX, TCO, productivity, traffic load and network quality KPIs – with a peer group solely consisting of network sharing joint ventures. Continue reading Network sharing JV benchmark 2017
Nordic operator benchmark 2017
![]() Benchmarks, 2017
Benchmarks, 2017
For the fifth consecutive year: Comprehensive business benchmark including more than 600 KPIs covering revenue, OPEX, CAPEX, headcount productivity, subscriptions & channels, performance, load, quality and innovation & growth – for 41 functions of mobile, fixed/cable and integrated operators – respectively. Continue reading Nordic operator benchmark 2017
Analysis and interviews on CAPEX efficiency and predictive analytics
Analysis and Go-to-market, 2017
Writing a comprehensive analysis on CAPEX efficiency and the use of predictive analytics in mobile network design in cooperation with Omnitele.
The analysis can be downloaded from this page:
http://www.omnitele.com/2017/increasing-precision-network-capex/
Continue reading Analysis and interviews on CAPEX efficiency and predictive analytics
Closing the loop on our predictions for 2016
When we in the end of December 2015 made nine predictions for 2016, our intention was that they should be measurable.
This is the moment of truth. With all reported operator data at hand, we can now close the loop on 2016.
 Prediction 1 – mobile data usage of 10 GB per month
At least one mobile operator will reach an average mobile data consumption of 10 GB per any SIM and month in 2016
It happened. The Finnish operator DNA carried a total of 345 petabyte of mobile data in 2016. If this traffic is averaged out over DNA’s average number of SIMs, it becomes 10.7 GB per SIM and month in 2016. Continue reading Closing the loop on our predictions for 2016
2016 was a great year for mobile customer loyalty
The fourth quarter has traditionally been the most difficult for mobile operators in mature markets. Many customers join, but many others are leaving and operators typically dilute margins by having more equipment (and more expensive equipment) in the sales mix compared to the rest of the year.
Subscriber acquisition and retention costs are generally higher in the fourth quarter when the financial discipline of mobile operators is put aside to promote equipment at prices well below the operator purchase costs – as long as existing customers promise to stay or new customers are ready to commit to plans with high monthly fees.
 But even though there are temporary setbacks, our industry is gradually moving in a more rational direction: Equipment subsidisation is less frequent today and many operators have stopped binding customers to long, inflexible, contracts. Mobile operators have developed their service offerings and are today capable of explaining why customers should stay – without having to throw in a new iPhone as part of the package. Continue reading 2016 was a great year for mobile customer loyalty