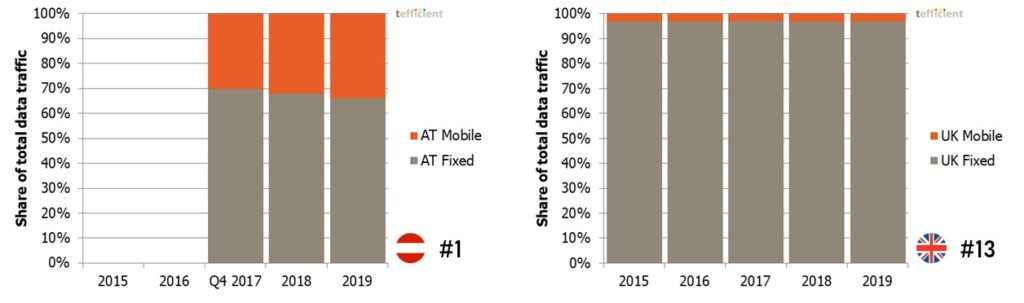
In our latest mobile data usage and revenue analysis, there are 43 countries. Of these, 27 are European. And among these, about half (13) of the regulators are not just reporting the mobile data traffic but also the fixed broadband traffic.
It allows us to compare the two and answer the question “is mobile eating fixed’s lunch?”
Tefficient’s 27th public analysis of the development and drivers of mobile data compares 44 countries from all regions of the world. We say hello to the new additions Chile, New Zealand and Qatar.
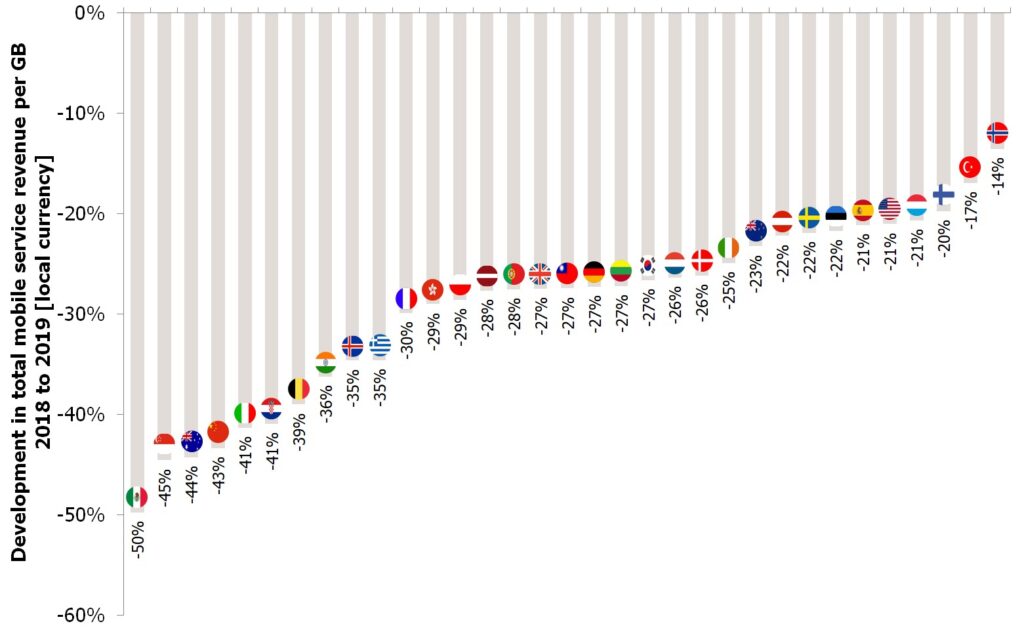
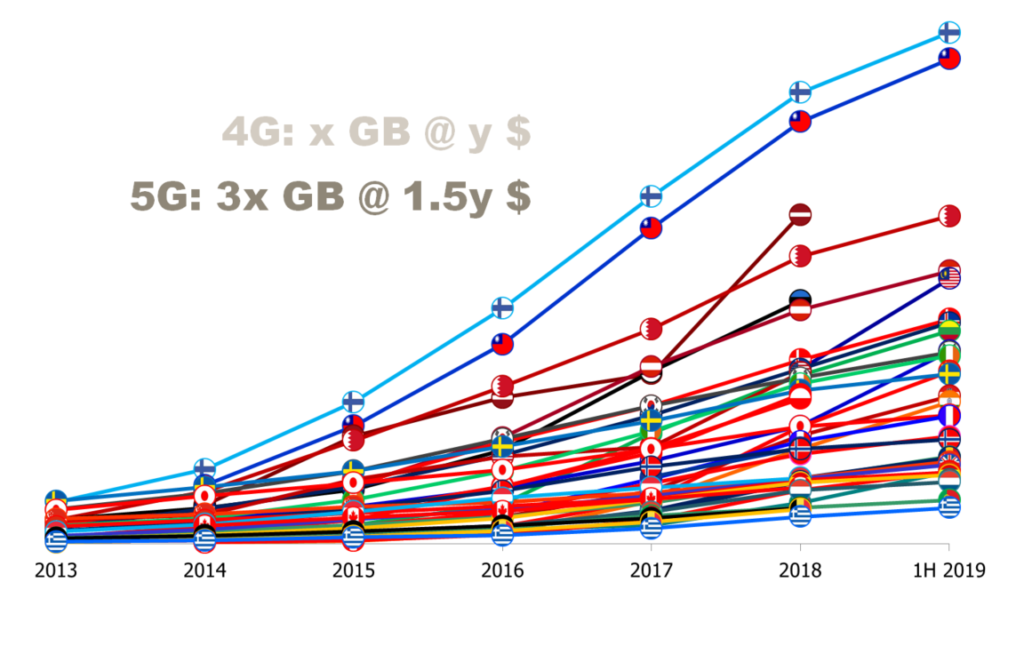
Usage is growing in every single country, but few are able to turn this into ARPU growth. Too few.
How have operators introduced fixed-mobile convergent plans in Europe’s most advanced markets France, Spain, Portugal, Belgium, Switzerland, the Netherlands – and in emerging FMC markets like the UK and Sweden? How – and how quickly – did competition react?
Using facts: What is the take-up of these FMC plans? How have the FMC introductions affected mobile and fixed market share, customer churn, acquisition & retention cost, demand for fibre and TV – and revenue and margin?
How do you avoid making FMC a discount-centric thing? How have the best FMC propositions been put together and how have they been marketed? Is there a way to leverage content and exclusivity?
For the eighth consecutive year: Comprehensive business benchmark with 890 KPIs covering revenue, OPEX, CAPEX, headcount productivity, subscriptions & channels, performance, load, quality and innovation & growth – for 54 functions of mobile, fixed/cable and integrated operators.
Peer group data exclusively from Swedish, Finnish, Norwegian and Danish operators. Due to pre-agreed confidentiality requirements, participating operators are anonymous (and of course their data).
The past three months have been a testing time for the UK mobile and broadband service providers, as many of them have battled with outages, vandalised phone masts amid lurid 5G conspiracy theories, extreme demand peaks. Store closures have placed added pressure on field, customer service and call centre staff who have been largely working from home. We all know the drill. All of us just want to get on with ‘getting back to normal’, safely past Covid-19, to life as we used to know it. But we don’t know how long it will take, or even if we will have the same breadth of services on the high street as before. Today, 15th of June, the shops are gradually and carefully opening their doors on UK high streets.
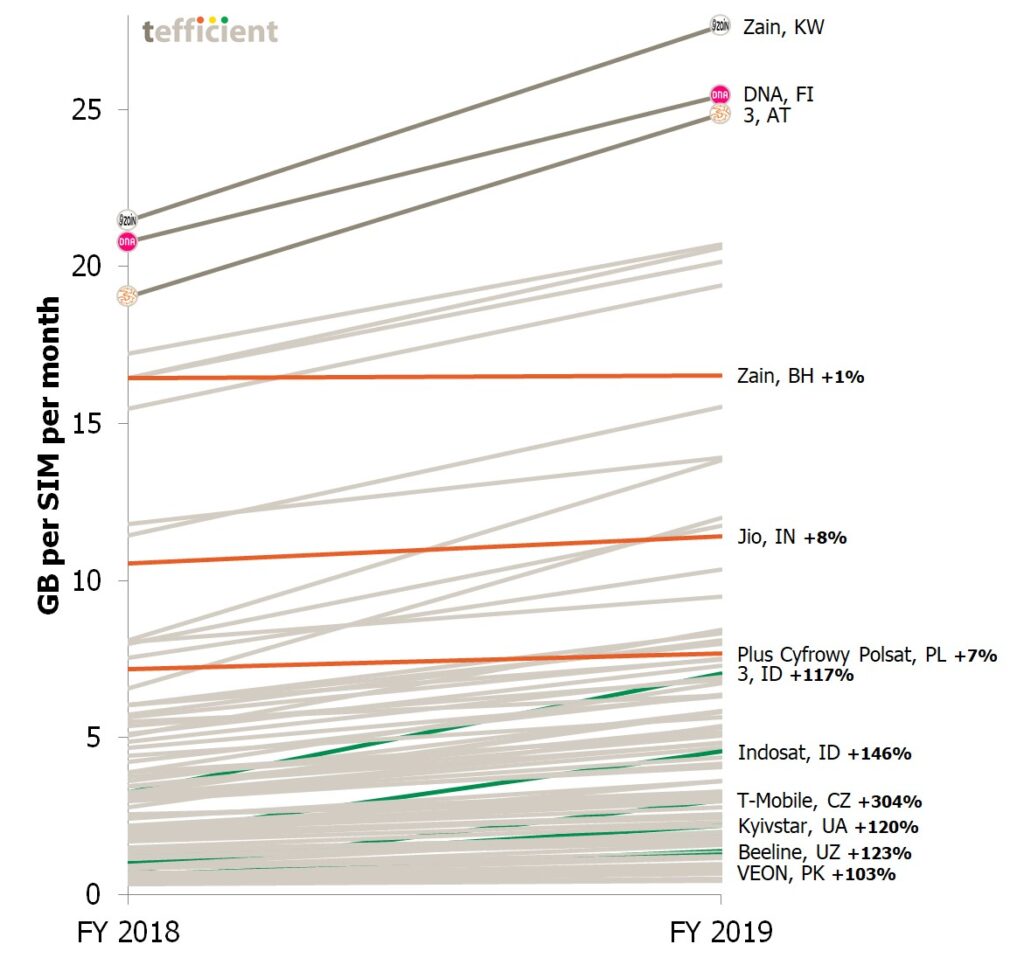
Tefficient’s 26th public analysis on the development and drivers of mobile data ranks 105 operators based on average data usage per SIM, total data traffic and revenue per gigabyte in 2019.
There are two types of operators when it comes to 5G: Those who act and those who wait.
Management of the latter type are often quoted saying that it’s within B2B that 5G will make a difference. It seems to be an excuse for not taking any action on B2C – or even for not taking any 5G action at all.
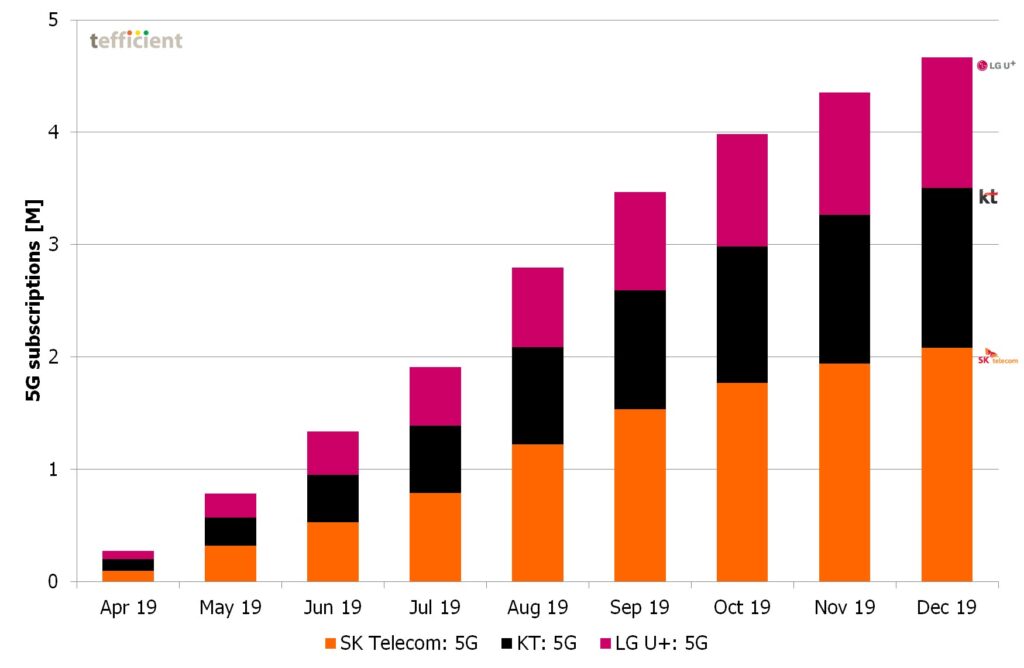
Lobbyists coined the term “the race to 5G”. If there ever was such a race, South Korea won it as unlike other markets there are – read on – many reported numbers to support a leadership claim. With 4.7 million 5G subscriptions by the end of 2019, 7% of Korea’s mobile subscribers used 5G just nine months after launch.
LG U+ site with Huawei 5G gear on the Namsan park above Seoul (photo: Fredrik Jungermann)
The subscriber take-up has been fast, but not linear. In August, September and October, when Samsung launched three new 5G smartphones (Note 10, A90 and Fold) and LG updated its V50 smartphone, 5G sales was exceptionally fast. During November and December no new smartphones were introduced and South Korea missed the expectation of 5 million 5G subscribers by year end 2019.
5G subscriber base per month since launch 5th of April (source data: MSIT)
Without subscription growth it’s difficult for mature market operators to report service revenue growth.
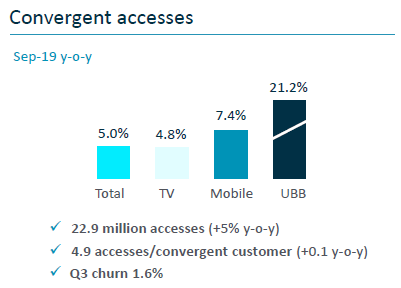
Some operators – anxious to still show growth – have thus begun to regularly highlight their fixed-mobile convergence base in quarterly results presentations. It’s most often a smoke screen. Here are seven examples – of which six aren’t growth stories.