Reference: Analysis, 2024
The Hellenic Telecommunications & Post Commission, EETT, functions as Greece’s national regulatory authority for telecommunications.
In response to EETT’s request, Tefficient has conducted an extensive benchmark analysis, focusing on value for money, spanning twelve EU and Euro countries: Austria, Belgium, Croatia, France, Germany, Greece, Ireland, Italy, Lithuania, the Netherlands, Slovenia, and Spain.
While the primary focus of the benchmark is on Greece, its insights provide valuable perspectives for the telecommunications industry in the remaining eleven countries.
Key conclusions for Greece include:
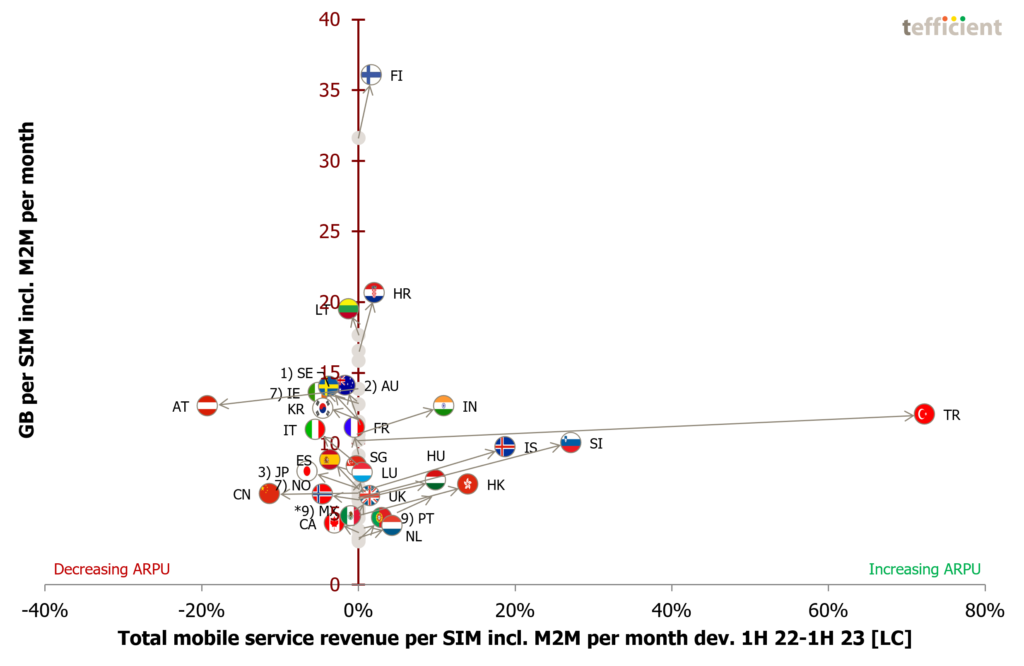
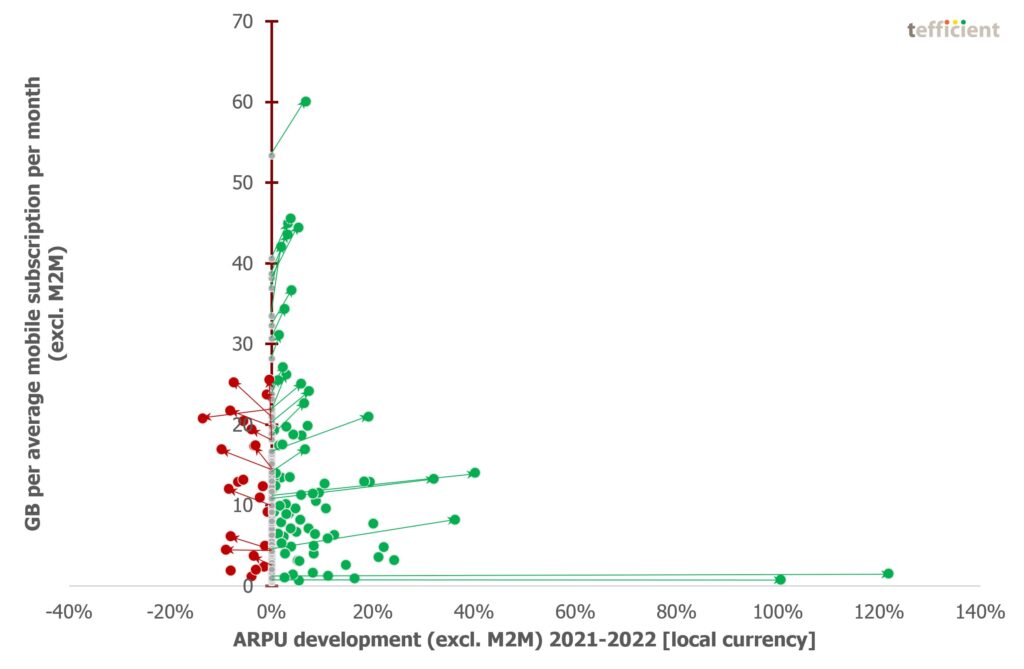
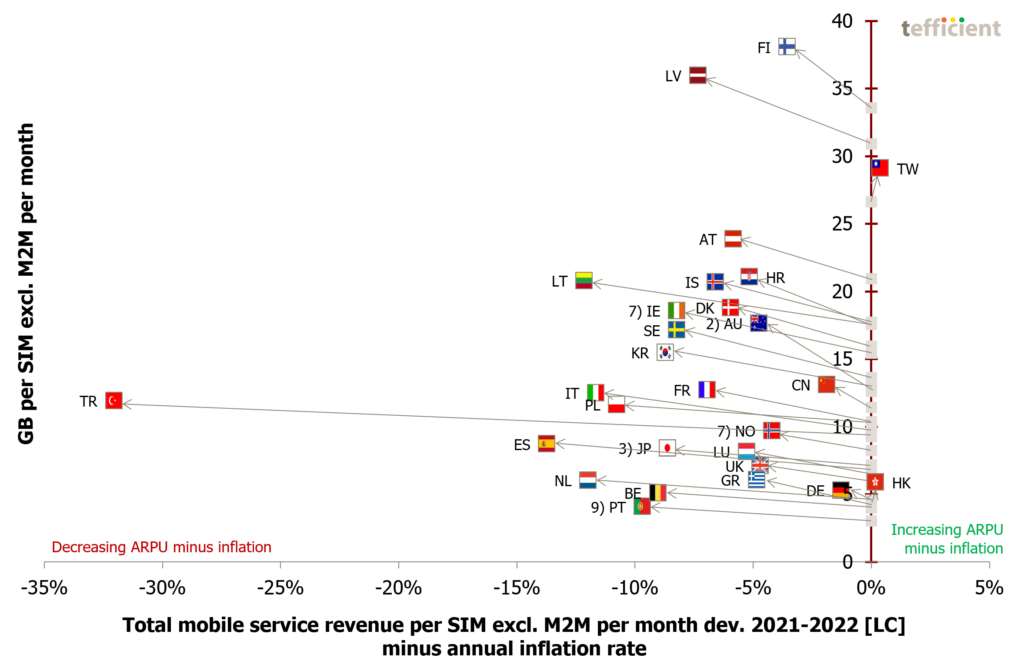
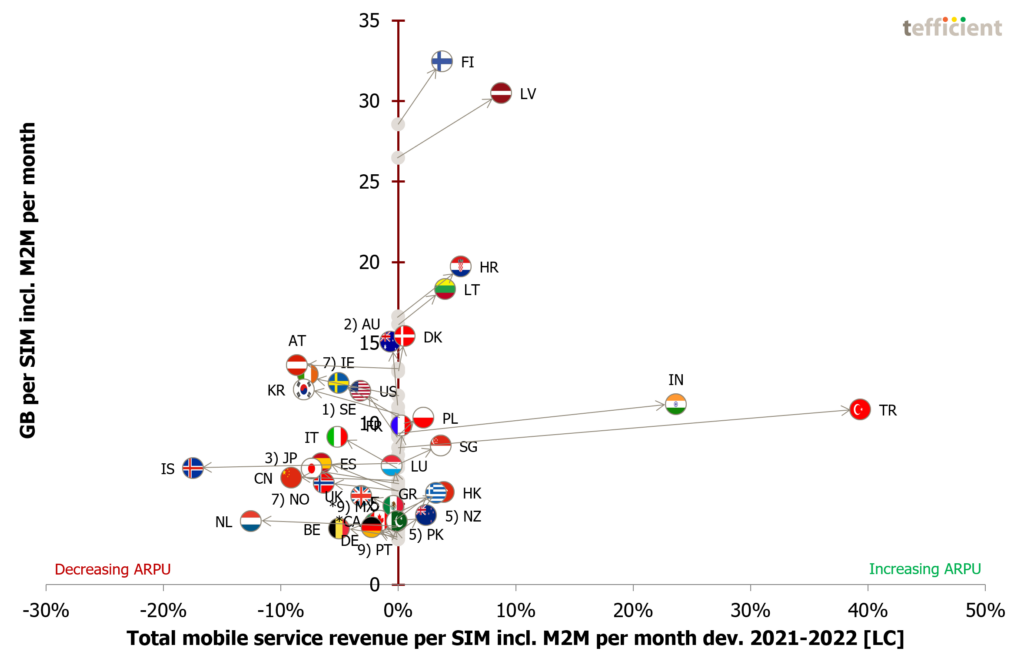
- Mobile Average Revenue Per User (ARPU) is approximately on par but with a notable increase
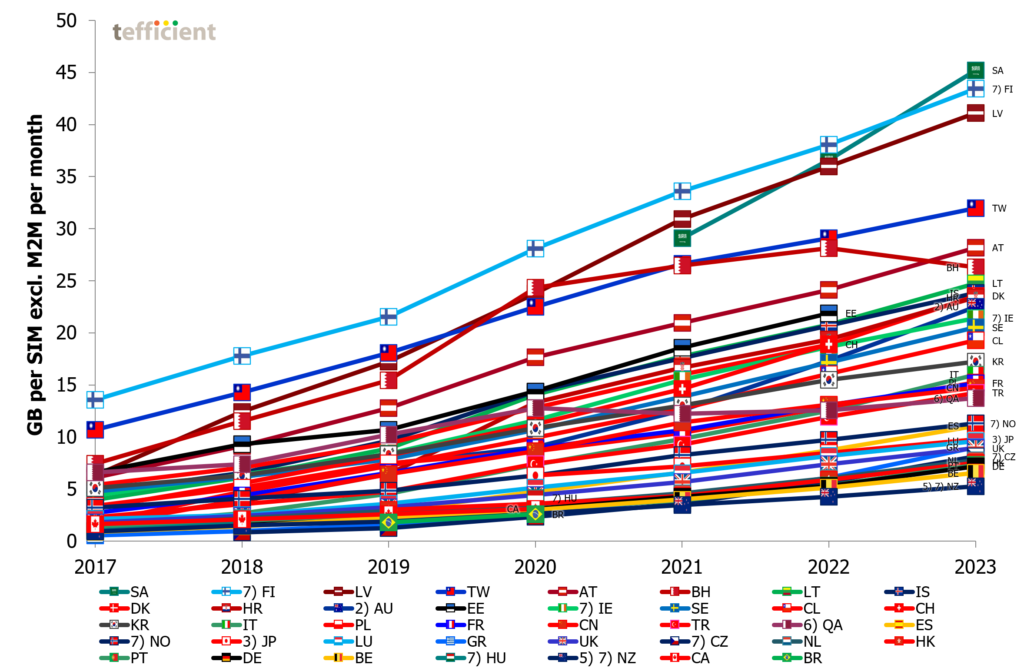
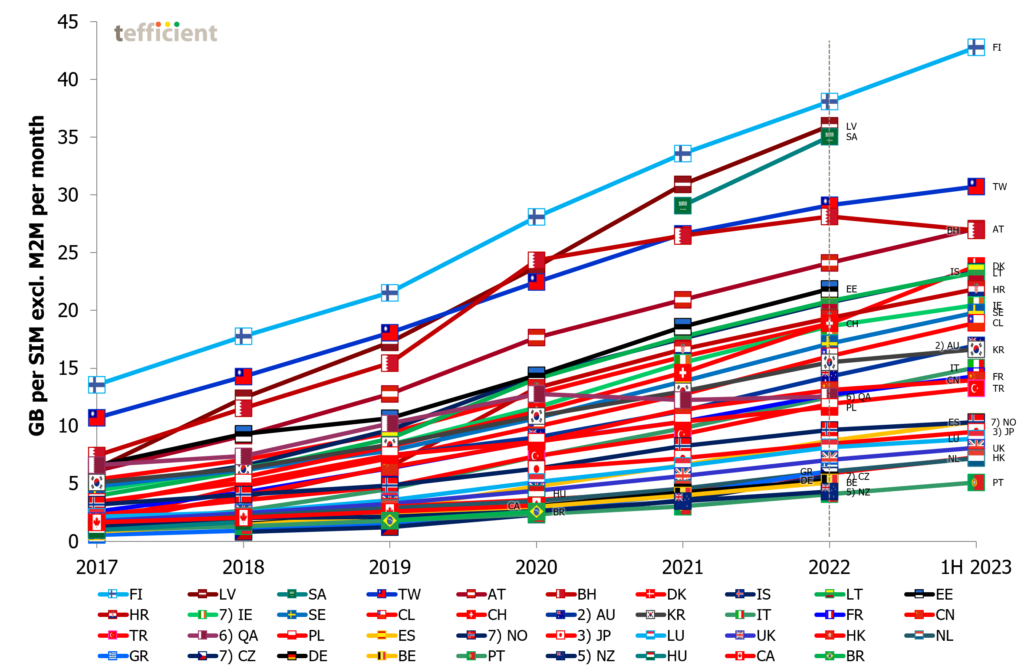
- Mobile data usage is low but exhibits the most significant growth
- Voice usage is the highest among the peer group but continues to see robust growth
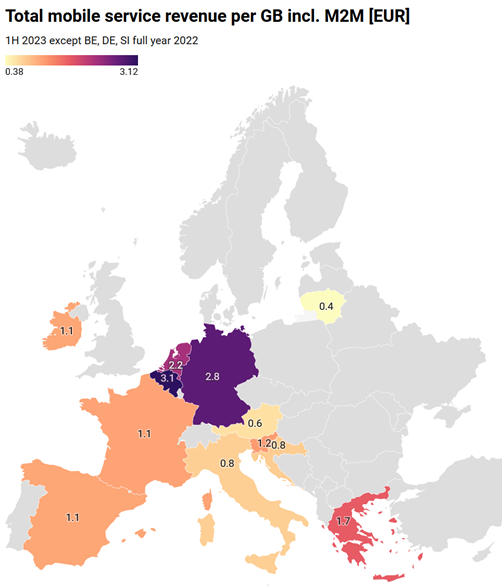
- The total mobile revenue per gigabyte of mobile data is high but demonstrates a marked decrease
- Voice revenue per mobile voice minute aligns with the median and experiences median erosion
- In terms of value for money, Greece ranks weaker in data offerings compared to most of its peers but stronger than most in voice services
Several selected example graphs are presented below.
Continue reading Evaluating mobile service value for money across 12 EU countries →