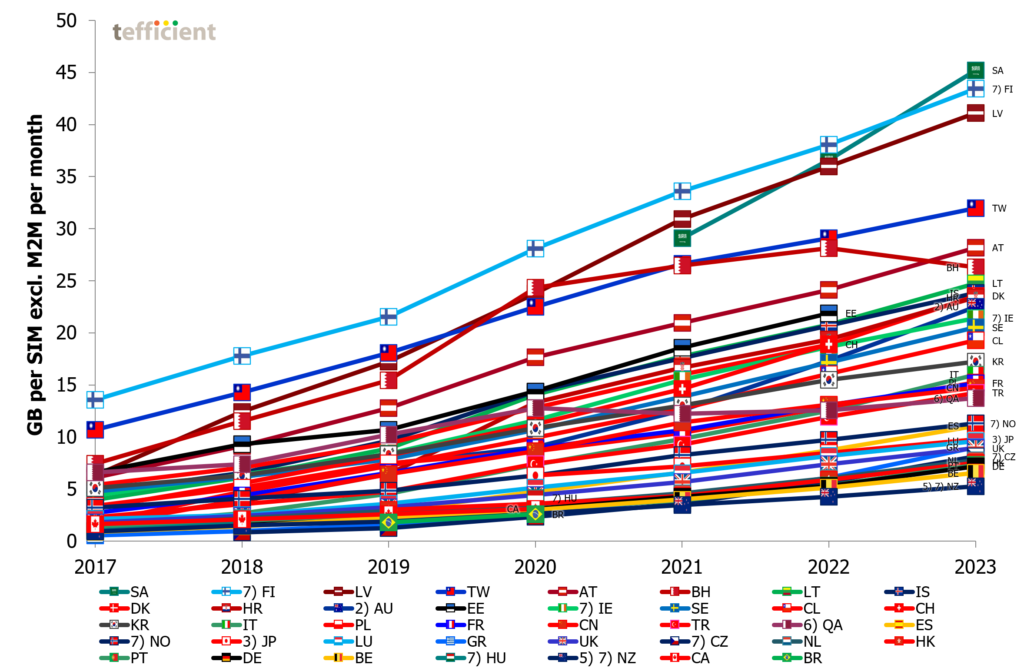
Tefficient’s 41st public analysis of mobile data development and drivers compares 39 countries worldwide, where M2M/IoT can be excluded from the total bases. Mobile data usage grew in 38 of these, with Bahrain as the only exception.
Finland no longer leads in usage
For the first time since 2013, Finland doesn’t lead in usage. Saudi Arabia is the new world leader with more than 45 GB per average subscription in 2023.
The Hellenic Telecommunications & Post Commission, EETT, functions as Greece’s national regulatory authority for telecommunications.
In response to EETT’s request, Tefficient has conducted an extensive benchmark analysis, focusing on value for money, spanning twelve EU and Euro countries: Austria, Belgium, Croatia, France, Germany, Greece, Ireland, Italy, Lithuania, the Netherlands, Slovenia, and Spain.
While the primary focus of the benchmark is on Greece, its insights provide valuable perspectives for the telecommunications industry in the remaining eleven countries.
Key conclusions for Greece include:
Mobile Average Revenue Per User (ARPU) is approximately on par but with a notable increase
Mobile data usage is low but exhibits the most significant growth
Voice usage is the highest among the peer group but continues to see robust growth
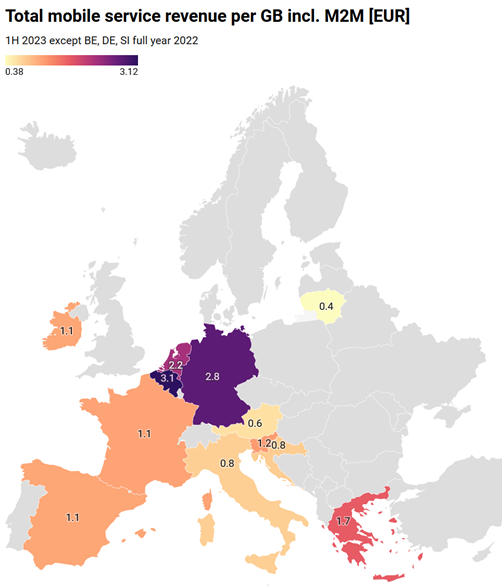
The total mobile revenue per gigabyte of mobile data is high but demonstrates a marked decrease
Voice revenue per mobile voice minute aligns with the median and experiences median erosion
In terms of value for money, Greece ranks weaker in data offerings compared to most of its peers but stronger than most in voice services
Several selected example graphs are presented below.
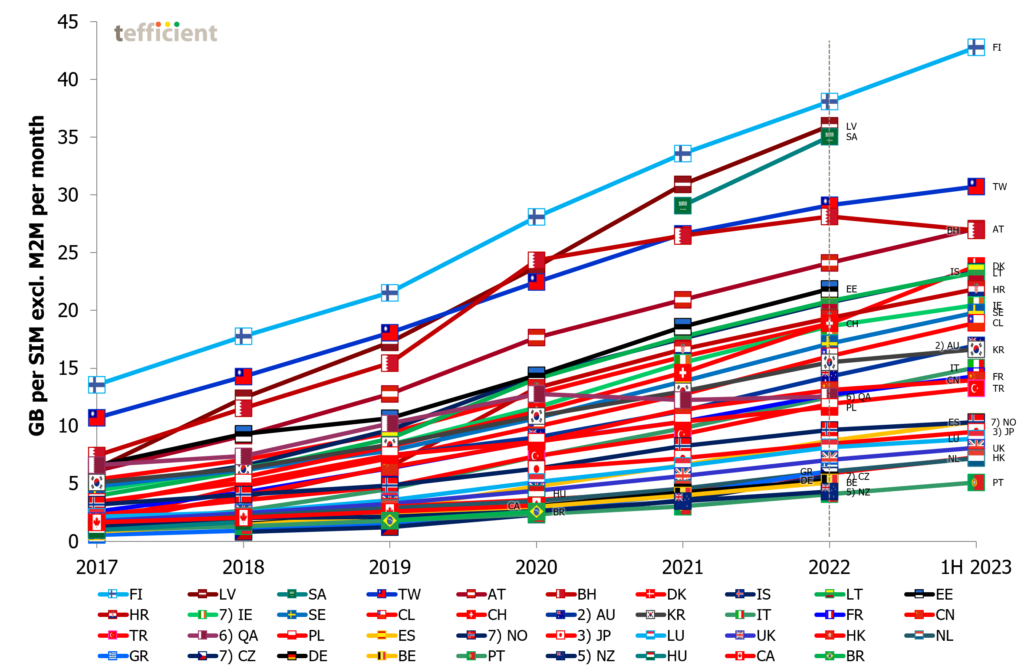
Tefficient’s 39th public analysis of mobile data development and drivers compares 39 countries worldwide, where M2M/IoT can be excluded from the total bases. Mobile data usage grew in 38 of them – with Bahrain as the only exception.
If you’d rather see the analysis including M2M, go here.
When usage grows, the growth rates are slowing. Portugal leads with a growth rate of 47%, contrasting with Taiwan‘s modest 8% growth. Bahrain experienced a decline of 6% in data usage.
Data-only subscriptions continue to dominate average mobile data usage, although their market share remains limited. Latvia‘s average data-only subscription consumed 138 GB per month in 2022 while Austria recorded 115 GB in the first half of 2023. In the FWA-only category, Australia had a remarkable 334 GB per month in 1H 2023.
While data-only drives traffic, the same can’t be said for 5G
Reporting is imperfect, but there are only three countries with disproportionately high 5G traffic in relation to their 5G bases: South Korea, Austria and Saudi Arabia. We explain what these countries do and what other countries are missing.
The Q3 results just reported by Telia Company, Telenor, Tele2, 3 Scandinavia and Elisa show that it’s quite difficult not to be successful as a Nordic telco today.
Revenue and ARPU is growing. OPEX grows too, but slower than the revenue, so the EBITDA margins are increasing. Churn is decreasing. CAPEX is in decline. More cash is being generated.
We have identified seven signs that competition in cooling down in Nordic telco.
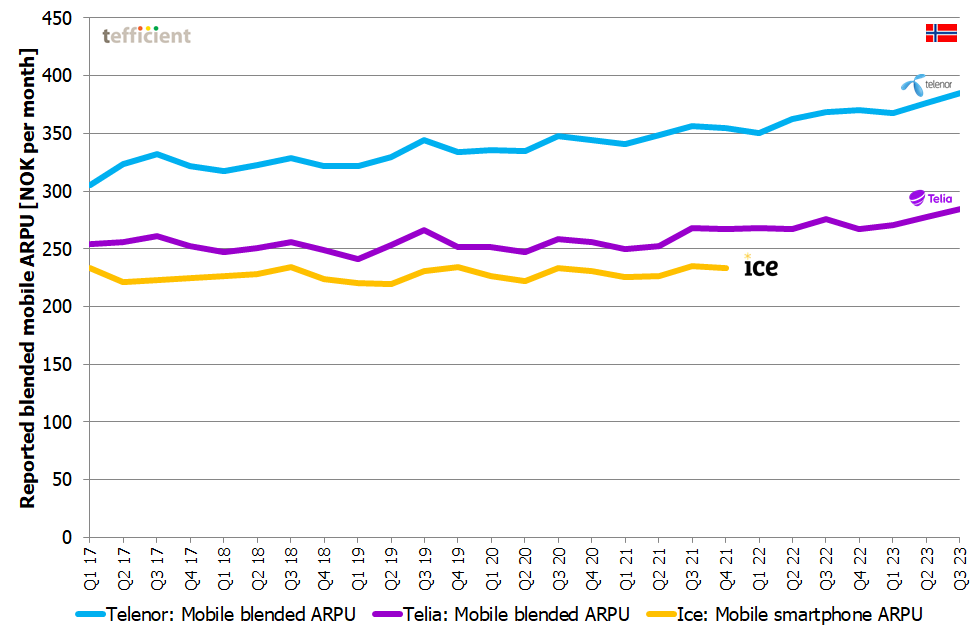
Sign 1. Mobile ARPU grows
Let’s start with Norway. The reported blended mobile ARPU has quite steadily increased for the two MNOs that still report it. For Telenor it grew 4% year-on-year to Q3 2023. For Telia it grew 3%.
Figure 1. Mobile ARPU, Norway (source data: operator reports)
In Sweden, the ARPU development has been a bit more dramatic than in Norway. Three players, first 3, then Telenor and the B2B side of Tele2, witnessed their ARPUs going down from 2018 to the first half of 2021. A corona effect, you might say. Not really; it started before corona started (Q1 2020) and compare with Telia who could keep their ARPU steady or even increase it when 3, Telenor and Tele2 B2B seemingly fought a battle on price.
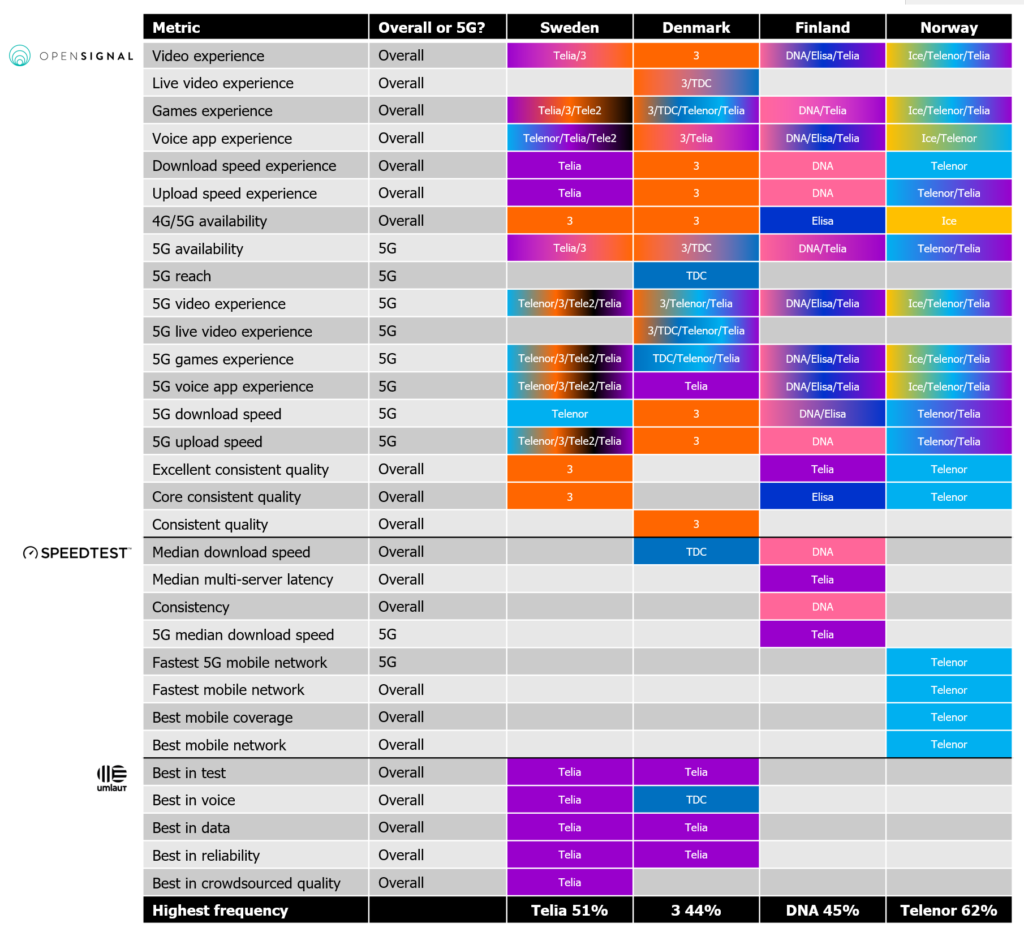
But there are several companies – some with global, some with local ambitions – that offer their take on who has the best mobile network. To differentiate, providers define different metrics and use different methodologies. Rather than boring you with those, we have compiled a cross-case table naming the winner per each metric across three global network experience specialists: Opensignal (now having merged with Tutela), Ookla Speedtest and umlaut.
We have included the latest overall or 5G-specific tests made public in Q4 2022 or 2023.
Fiberalliancen is a trade association for companies that own, operate and use fibre networks in Denmark. It is a part of Green Power Denmark.
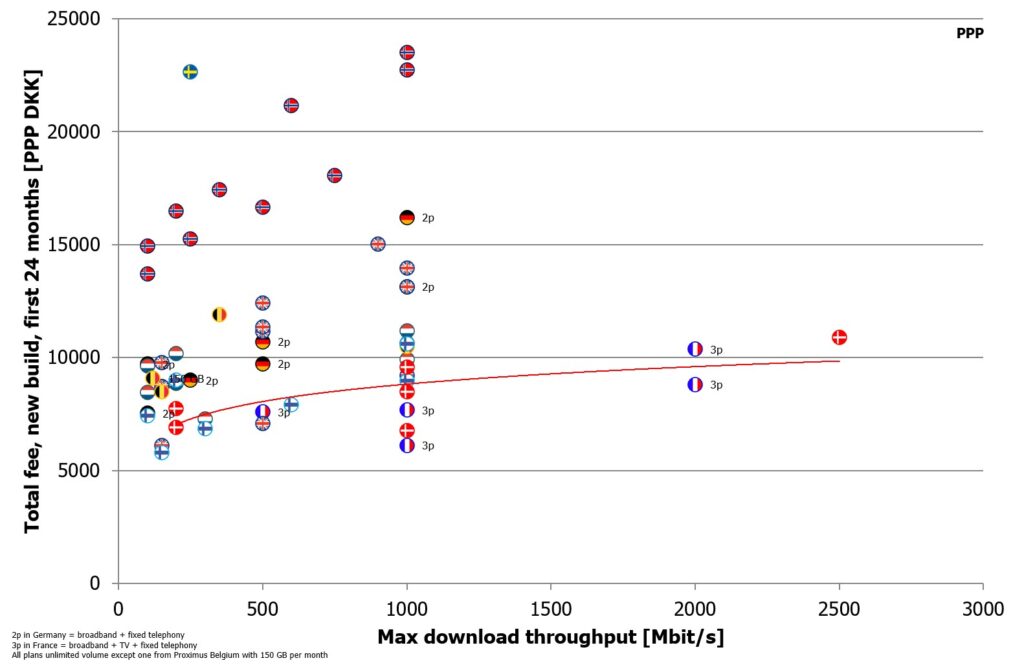
For the third time (previously done in 2021 and in 2022), Tefficient has performed a comprehensive fibre broadband pricing benchmark covering nine European markets: Denmark, Sweden, Norway, Finland, Germany, the Netherlands, Belgium, the UK and France.
In a press release, Fiberalliancen introduces Tefficient’s analysis and makes it publicly available. Download it from the right ‘Dokumenter’ column. It’s in English.
The release concludes that:
Denmark has some of the lowest consumer prices for both new and existing fibre connections.
Danish consumer prices – both for new and existing connections – have overall fallen from 2022 to 2023. This is only seen in Denmark and the Netherlands.
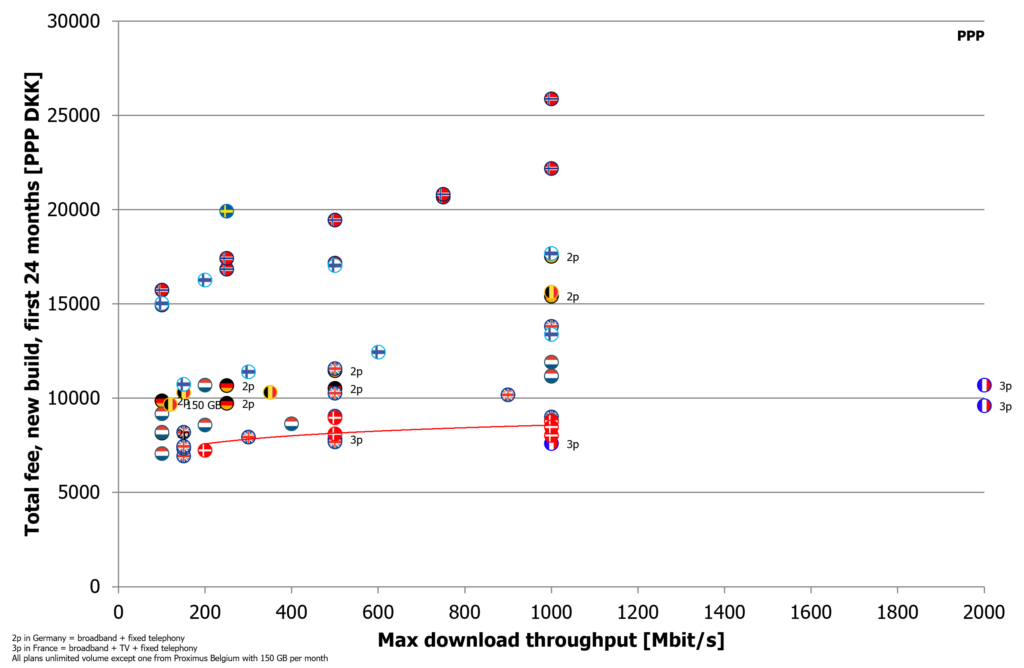
Tefficient’s approach has been thorough and the results are presented in a set of graphs like below.
Example graph from the analysis showing the total 2-year fee for the new build fibre case. The red trend line highlights Denmark’s position.
Norway’s Ministry of Local Government and Regional Development last week published two analyses commissioned from Tefficient.
The conclusion is summarised (in Norwegian) in a press release from the Ministry.
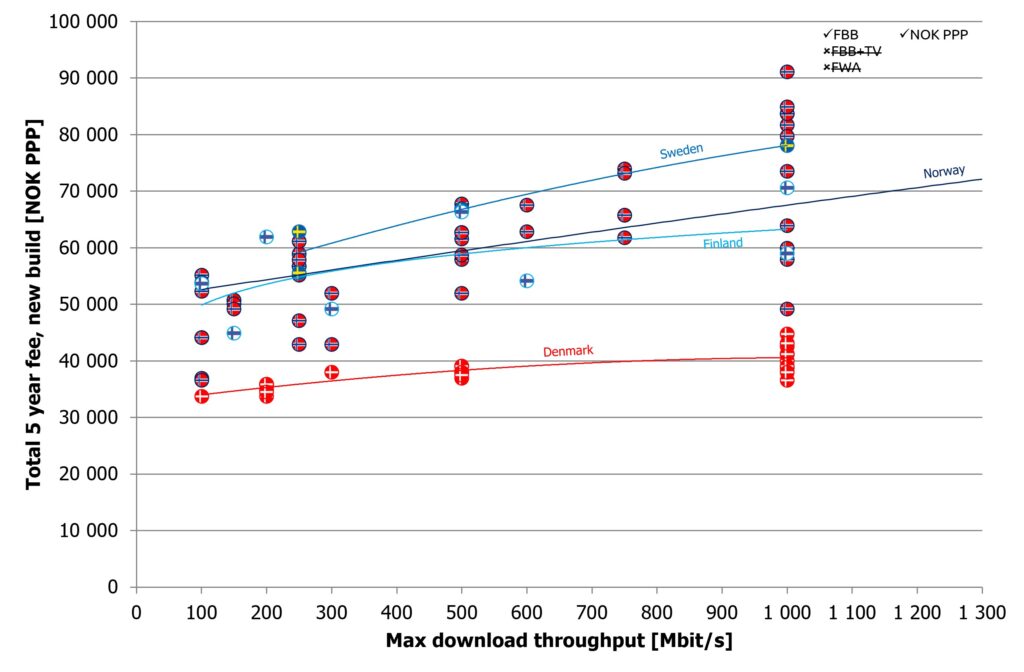
Both analyses are quite comprehensive and compare Norway to the three fellow Nordic countries Denmark, Sweden and Finland. It means that they are highly interesting not just for the industry and policy makers in Norway, but in all four countries.
An example graph from the fixed analysis:
Since the Ministry has made both analyses available for public download, you can access them directly and for free from here:
In its tenth year, our comprehensive business benchmark raised the standard with an extensive range of 964 key performance indicators (KPIs). Covering crucial areas such as revenue, OPEX, CAPEX, headcount productivity, subscriptions & channels, performance, load, quality, and innovation & growth, this benchmark caters to 53 functions across mobile, fixed, and integrated operators.
Exclusively sourced from leading Swedish, Finnish, Norwegian, and Danish operators, the peer group data is of the highest quality. To honor pre-agreed confidentiality requirements, participating operators remain anonymous, safeguarding the privacy of their data.
Tefficient’s benchmark has earned the reputation of being the industry’s best-kept secret. However, its outstanding value has enticed a couple of new participants this year, joining the returning operators who actively rely on the benchmark to drive continuous improvement.
For the ninth year: Comprehensive business benchmark with 895 KPIs covering revenue, OPEX, CAPEX, headcount productivity, subscriptions & channels, performance, load, quality and innovation & growth – for 53 functions of mobile, fixed and integrated operators.
Peer group data exclusively from Swedish, Finnish, Norwegian and Danish operators. Due to pre-agreed confidentiality requirements, participating operators are anonymous (and of course their data).
The results demonstrate the value of a region-specific benchmark approach: Nordic operators have global leadership in a wide array of business aspects and a global benchmark would therefore leave them without guidance on how to improve further. In contrast, participating operators now have a great tool to improve their local competitiveness even further.
As every year, the Nordic operator benchmark will be enhanced further based on input from participants. It will run again in January 2023. Read more about the benchmark here.
Fiberalliancen is a trade association for companies that own, operate and use fibre networks in Denmark. It is a part of Green Power Denmark.
For the second time (the first analysis was done in 2021), Tefficient has performed a comprehensive fibre broadband pricing benchmark covering nine European markets: Denmark, Sweden, Norway, Finland (new since 2021), Germany, the Netherlands, Belgium, the UK and France.
As part of a press release, Fiberalliancen makes Tefficient’s analysis publicly available. Download it from the right ‘Links’ column. It’s in English.
The release concludes that:
Denmark has some of the lowest consumer prices for both new and existing fibre connections. Only French consumers generally get a better deal than Danish consumers.
Danish consumer prices – both for new and existing connections – have overall fallen from 2021 to 2022. This is only seen in Denmark and the UK.
According to Ookla, Denmark has the fastest median broadband download speeds among the countries included in the comparison.
Tefficient’s approach has been thorough and the results are presented in a set of graphs like below.