Reference: Analysis, 2023
Fiberalliancen is a trade association for companies that own, operate and use fibre networks in Denmark. It is a part of Green Power Denmark.
For the third time (previously done in 2021 and in 2022), Tefficient has performed a comprehensive fibre broadband pricing benchmark covering nine European markets: Denmark, Sweden, Norway, Finland, Germany, the Netherlands, Belgium, the UK and France.
In a press release, Fiberalliancen introduces Tefficient’s analysis and makes it publicly available. Download it from the right ‘Dokumenter’ column. It’s in English.
The release concludes that:
- Denmark has some of the lowest consumer prices for both new and existing fibre connections.
- Danish consumer prices – both for new and existing connections – have overall fallen from 2022 to 2023. This is only seen in Denmark and the Netherlands.
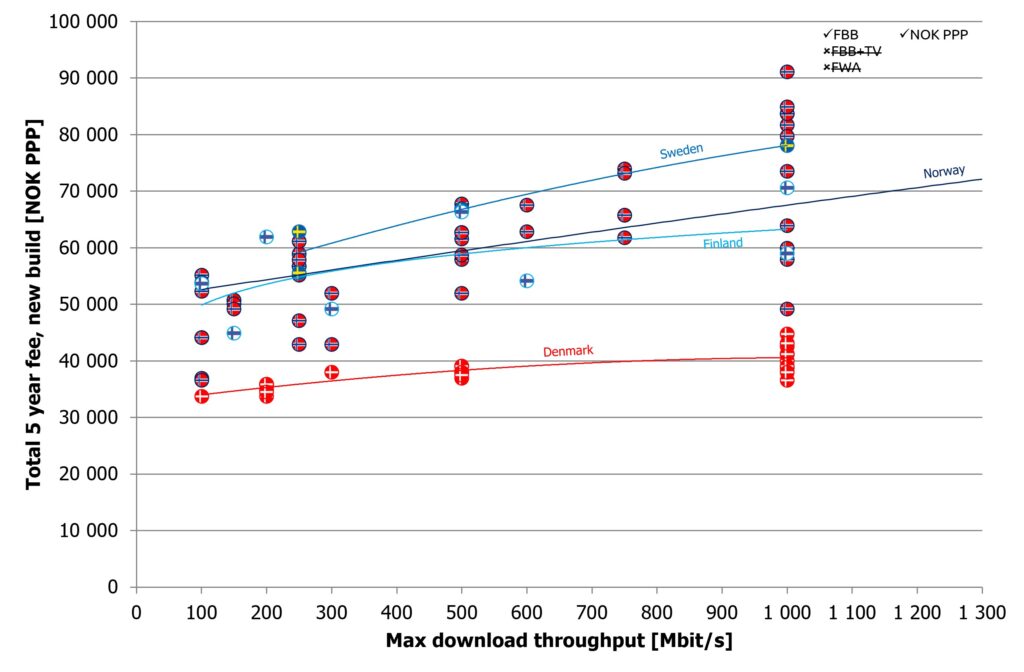
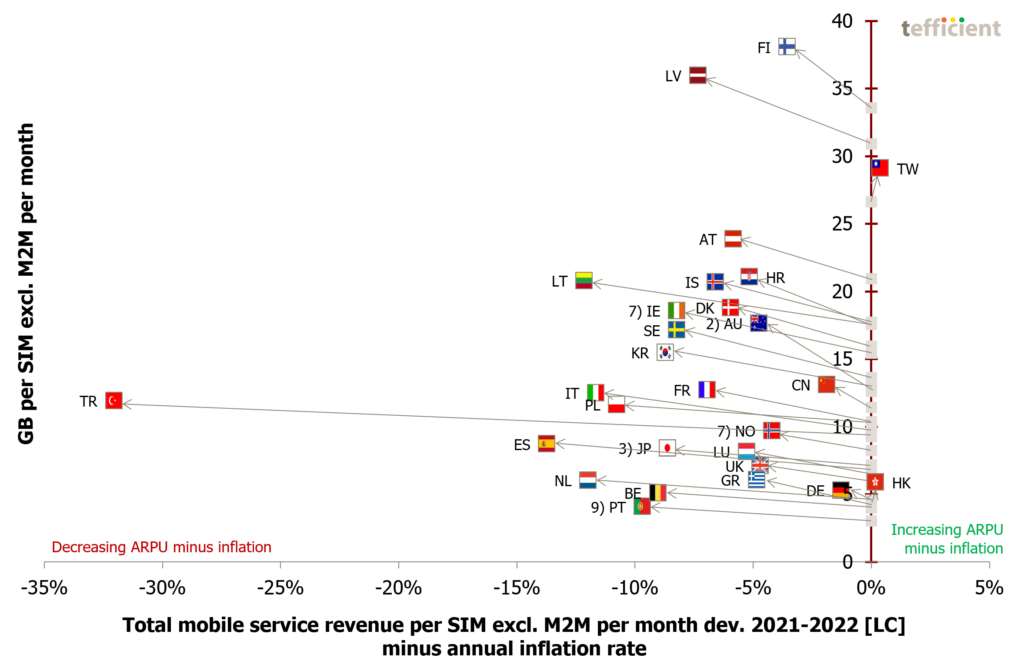
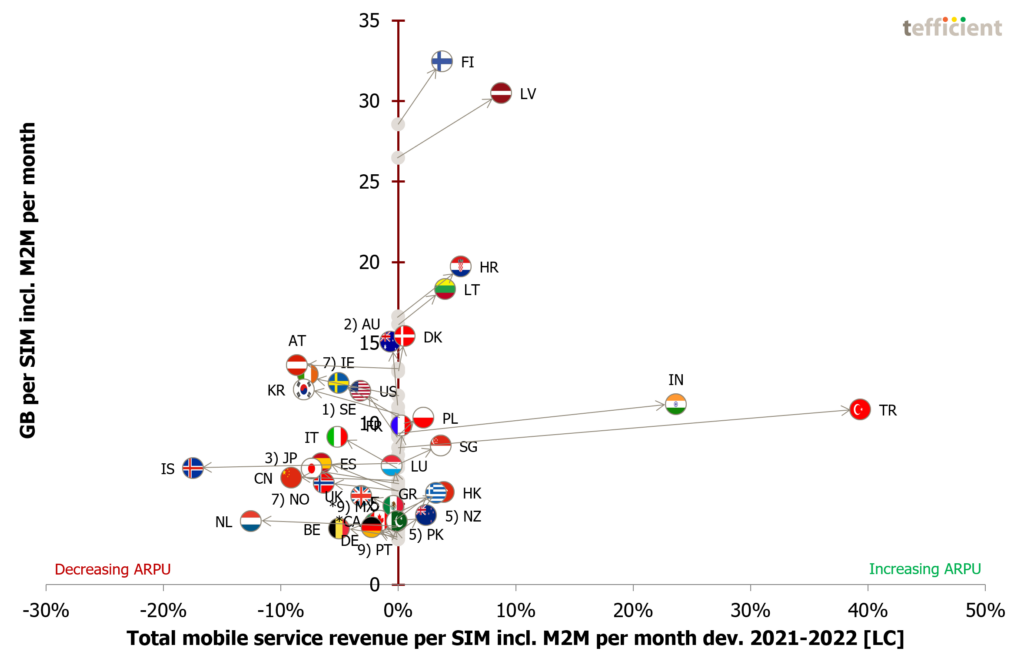
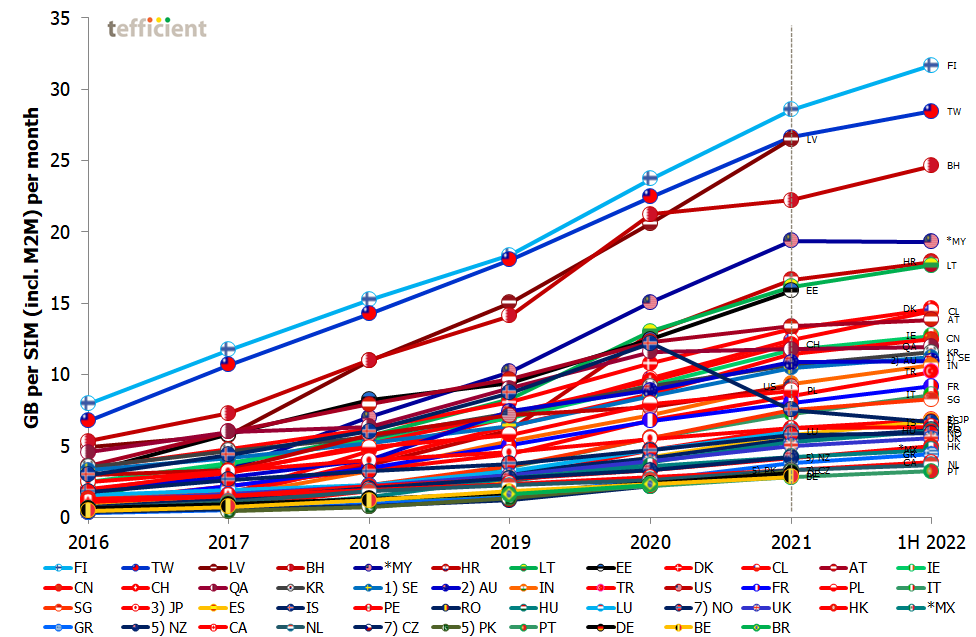
Tefficient’s approach has been thorough and the results are presented in a set of graphs like below.
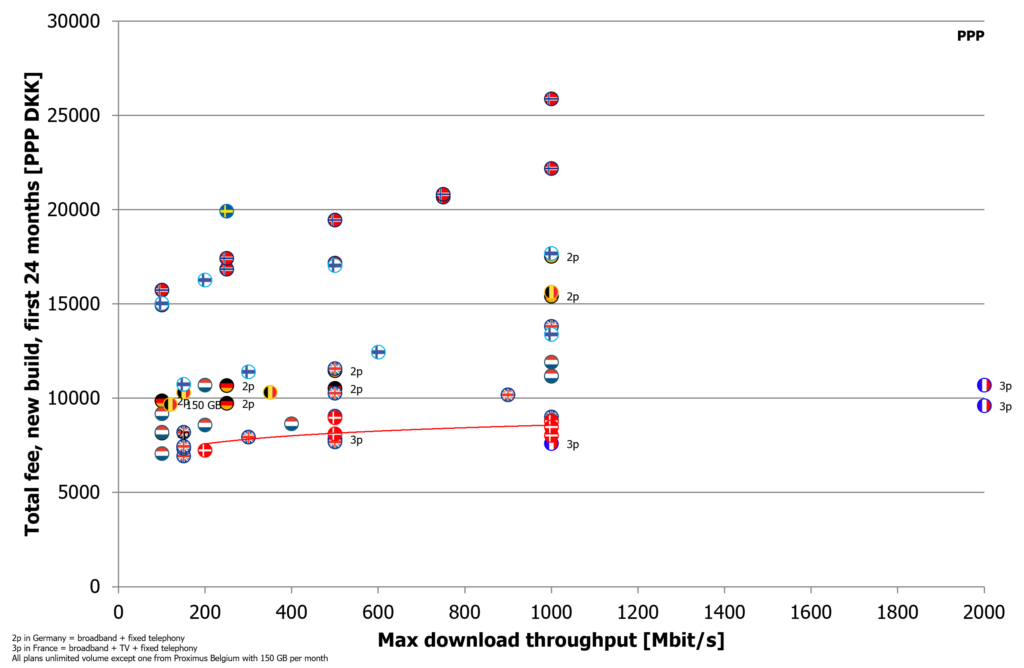
Example graph from the analysis showing the total 2-year fee for the new build fibre case. The red trend line highlights Denmark’s position.
Commissioned by Fiberalliancen.